Categories: Technical analysis

GBPCAD Wave Analysis – 6 July 2023


– GBPCAD broke sideways price range

– Likely to rise to resistance level 1.7140

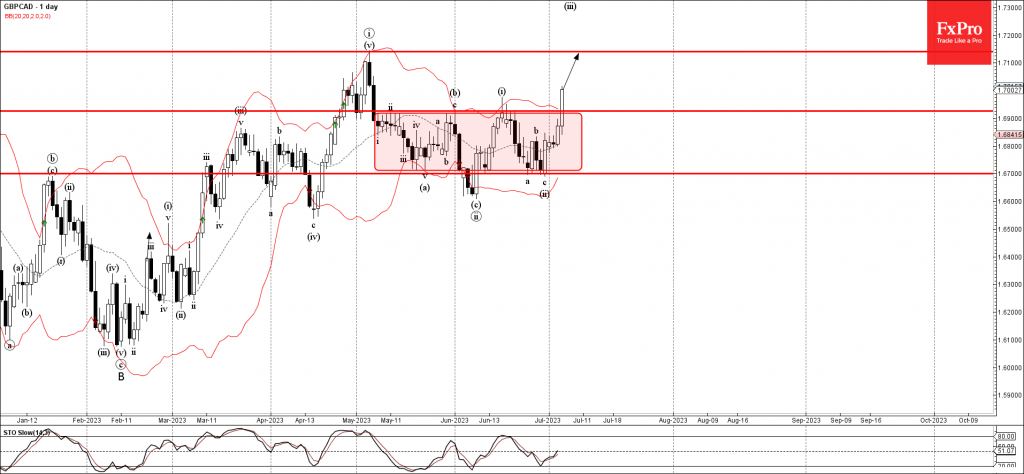
GBPCAD currency pair recently broke out of the narrow sideways price range inside which the pair has been trading from the start of May.

The breakout of this price range accelerated the active impulse waves (iii) and iii – which belong to the multi-month impulse sequence C from February.

Given the prevailing daily uptrend, GBPCAD currency pair can be expected to rise further toward the next resistance level 1.7140 (previous monthly high from May).

The FxPro Tech Analysis Team

The FxPro technical experts prepare a daily analysis of the most active currency pairs (majors, crosses, exotics) and commodities. Selected instruments are reviewed on daily trends (D1, H4), using the active Elliott Wave setups, Japanese candlesticks, indicators, and support/resistance levels.

Share
Published by
The FxPro Tech Analysis Team
Tags: GBPCAD

Recent Posts

EURCAD Wave Analysis 6 September 2024

- EURCAD reversed from pivotal support level 1.4900 - Likely to rise to resistance level…

1 day ago

EURUSD Wave Analysis 6 September 2024

- EURUSD reversed from support level 1.1030 - Likely to rise to resistance level 1.1200…

1 day ago

Further Unwinding of Carry Trade

The unwinding of the carry trade in the FX market continues, with the major safe…

1 day ago

Bitcoin pressured by risk-off mood

Market Picture The pressure on risk assets continues, pushing the crypto market capitalisation back below…

2 days ago

AUDUSD Wave Analysis 5 September 2024

- AUDUSD reversed from support level 0.6700 - Likely to rise to resistance level 0.6800…

2 days ago

Gold Wave Analysis 5 September 2024

- Gold reversed from support level 2475.00 - Likely to rise to resistance level 2535.00…

2 days ago

This website uses cookies