Categories: Technical analysis

GBPCAD Wave Analysis – 30 July, 2020

• GBPCAD rising inside impulse wave 3

• Likely to rise to 1,7700

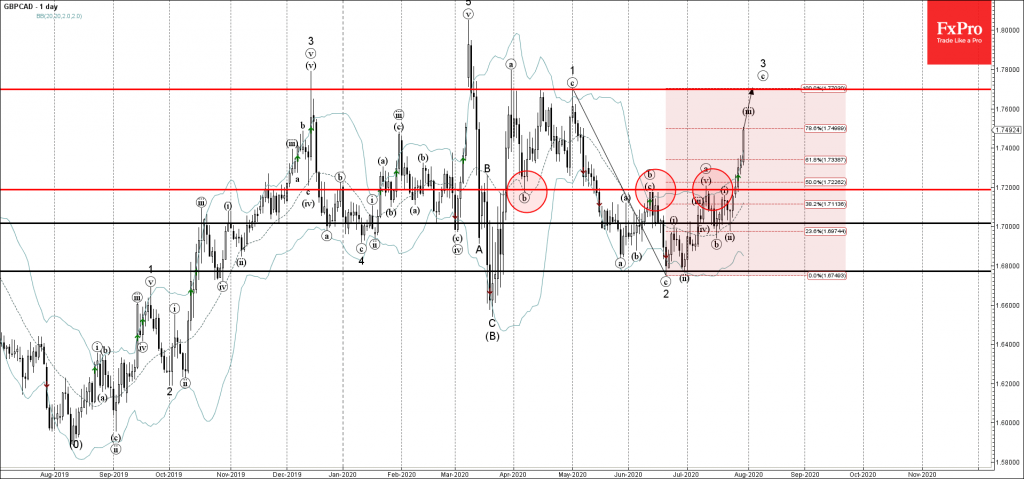
GBPCAD continues to rise inside the accelerated impulse wave 3 – which previously broke the resistance zone lying between the resistance level 1,7200 and the 50% Fibonacci correction of the previous ABC wave 2 from May.

The active impulse wave 3 belongs to the multi-month upward impulse sequence (C) from the middle of March.

GBPCAD is likely to rise further toward the next resistance level 1,7700 (former top of the sharp impulse wave 1 from the end of April).

The FxPro Tech Analysis Team

The FxPro technical experts prepare a daily analysis of the most active currency pairs (majors, crosses, exotics) and commodities. Selected instruments are reviewed on daily trends (D1, H4), using the active Elliott Wave setups, Japanese candlesticks, indicators, and support/resistance levels.

Share
Published by
The FxPro Tech Analysis Team
Tags: GBPCAD

Recent Posts

USDJPY Wave Analysis 26 April 2024

- USDJPY broke key resistance level 155.00 - Likely to rise to resistance level 160.00…

1 day ago

Ebay Wave Analysis 26 April 2024

- Ebay reversed from support level 49.35 - Likely to rise to resistance level 52.55…

1 day ago

False Alert with Yen Interventions?

Even though the Bank of Japan left the key rate and parameters of the QE…

2 days ago

Cooler Bitcoin

Market picture  Market Dynamics: The cryptocurrency market stabilised, losing just 0.1% of capitalisation and dropping to…

2 days ago

GBPCAD Wave Analysis 25 April 2024

- GBPCAD reversed from key support level 1.6910 - Likely to rise to resistance level…

3 days ago

GBPAUD Wave Analysis 25 April 2024

- GBPAUD reversed from support level 1.9135 - Likely to rise to resistance level 1.9360…

3 days ago

This website uses cookies