Categories: Technical analysis

GBPCAD Wave Analysis 28 January, 2021

• GBPCAD broke resistance area

• Likely to rise to resistance level 1.7675

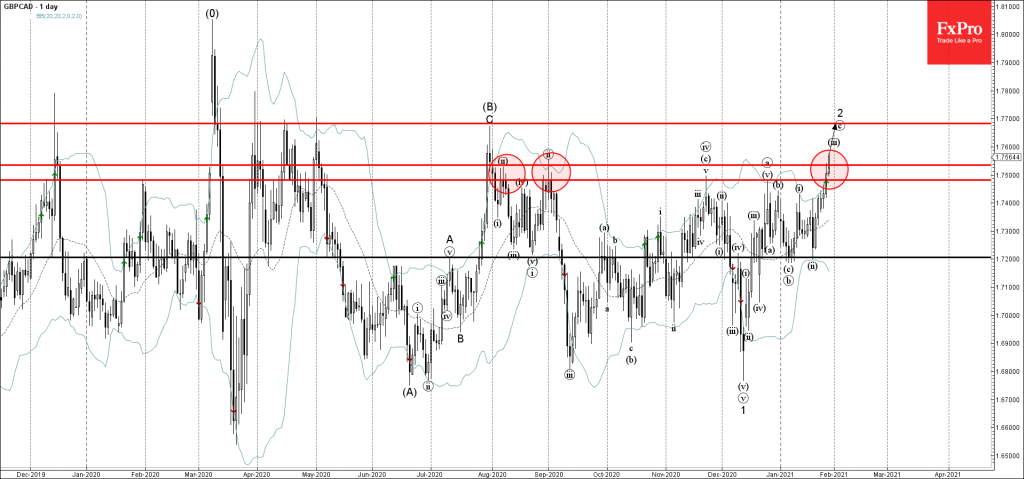
GBPCAD recently broke the resistance area lying between the resistance level 1.7480 (monthly high from November and December) and the resistance level 1.7535 (monthly high from September).

The breakout of this resistance area accelerated the active impulse wave (c) – which belongs to the minor ABC correction 2 from the start of last month.

GBPCAD is expected to rise further toward the next resistance level 1.7675 (monthly high from July and the target for the completion of the active ABC correction 2).

The FxPro Tech Analysis Team

The FxPro technical experts prepare a daily analysis of the most active currency pairs (majors, crosses, exotics) and commodities. Selected instruments are reviewed on daily trends (D1, H4), using the active Elliott Wave setups, Japanese candlesticks, indicators, and support/resistance levels.

Share
Published by
The FxPro Tech Analysis Team
Tags: GBPCAD

Recent Posts

EURJPY Wave Analysis 2 May 2024

- EURJPY under strong bearish pressure - Likely to fall to support level 163.10 EURJPY…

12 hours ago

WTI crude oil Wave Analysis 2 May 2024

- WTI broke round support level 80.00 - Likely to fall to support level 76.00…

12 hours ago

ADP hints at another strong NFP on Friday

The monthly ADP labour market report showed that America created 192K new jobs in April, above…

2 days ago

Fed’s hawkish tone risks sinking S&P500 to 4700

Bears showed strength ahead of the FOMC decision.  U.S. indices sagged on Tuesday as investors…

2 days ago

A new stage of Bitcoin’s decline

Market Picture  Bitcoin's closing price on Tuesday became the lowest since late February, confirming the…

2 days ago

Ebay Wave Analysis 30 April 2024

- Ebay under the bearish pressure - Likely to fall to support level 51.00 Ebay…

3 days ago

This website uses cookies