Categories: Technical analysis

GBPCAD Wave Analysis – 27 September, 2019

  • GBPCAD falling inside the minor correction 2
  • Likely to fall to 1.6200

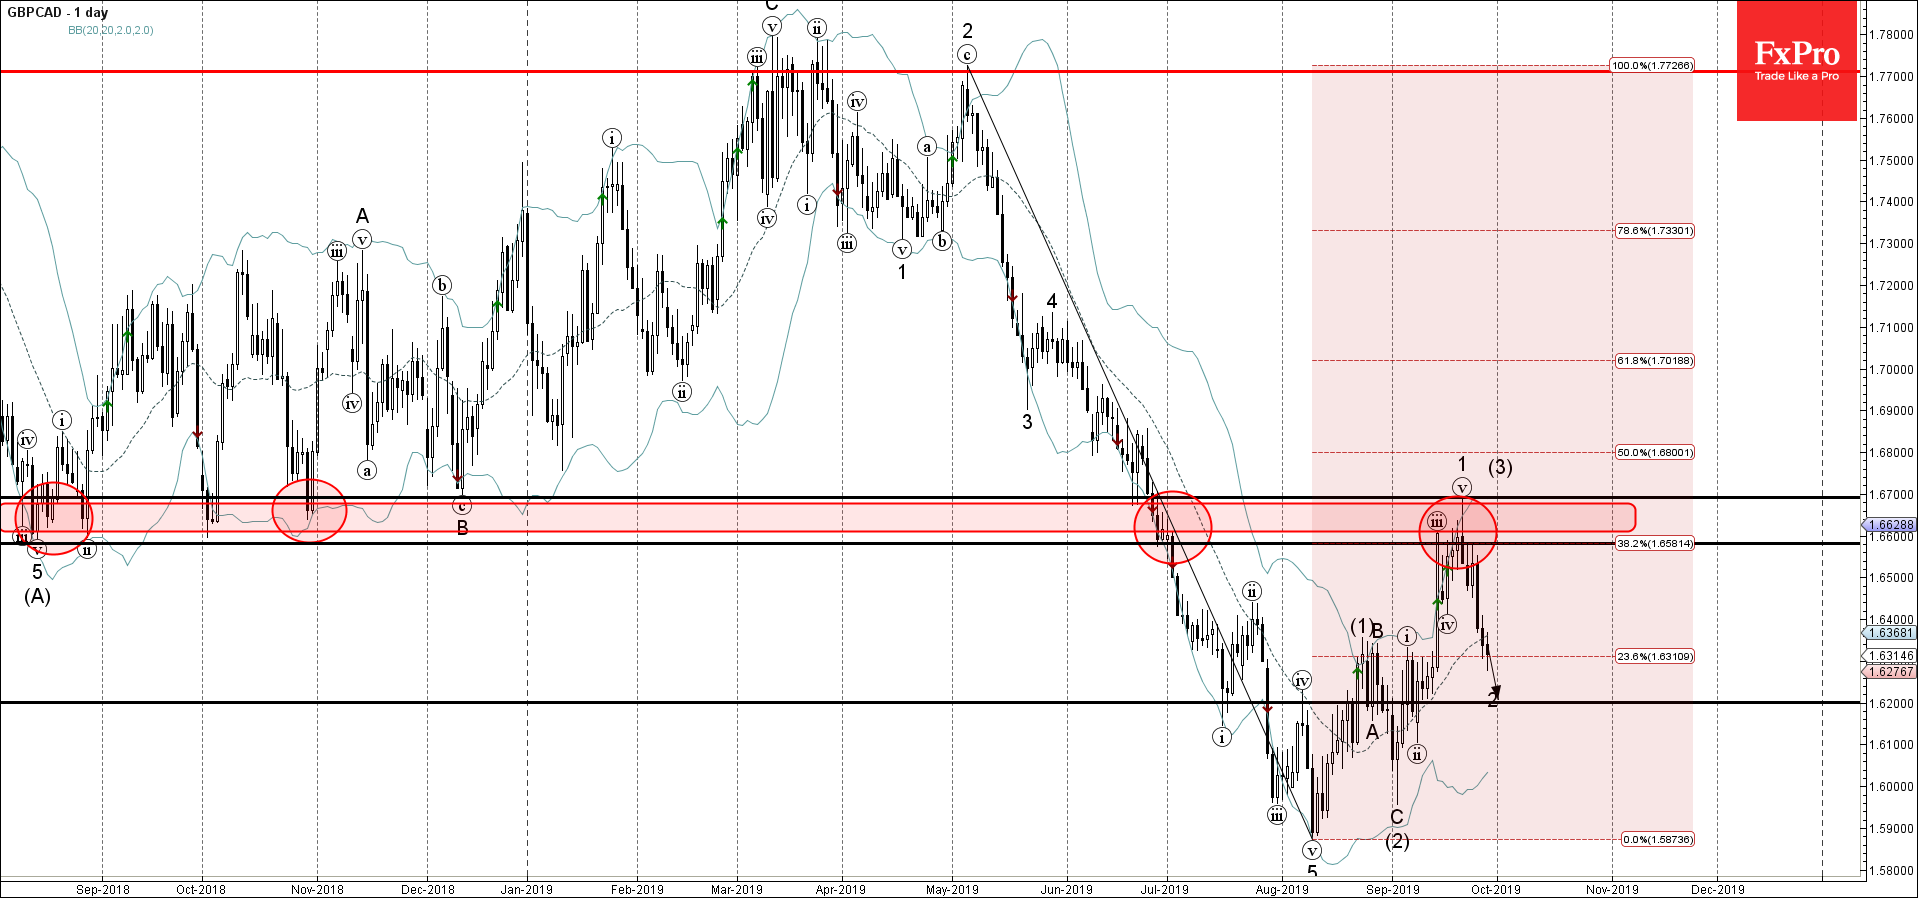
GBPCAD has been falling sharply in the last few trading sessions inside the minor correction 2 – which started earlier from the resistance area lying between the resistance levels 1.6700 and 1.6600.

This resistance area was further strengthened by the upper daily Bollinger Band and by the 38.2% Fibonacci correction of the previous downward impulse form May.

GBPCAD is expected to fall further and retest the next support level 1.6200 (target price for the completion of the active wave 2).

AddThis Website Tools
The FxPro Tech Analysis Team

The FxPro technical experts prepare a daily analysis of the most active currency pairs (majors, crosses, exotics) and commodities. Selected instruments are reviewed on daily trends (D1, H4), using the active Elliott Wave setups, Japanese candlesticks, indicators, and support/resistance levels.

Share
Published by
The FxPro Tech Analysis Team
Tags: GBPCAD

Recent Posts

AMD Wave Analysis – 28 March 2025

AMD: ⬇️ Sell - AMD reversed from pivotal resistance level 115.00 - Likely to fall…

4 hours ago

Google Wave Analysis – 28 March 2025

Google: ⬇️ Sell - Google broke key support level 160.00 - Likely to fall to…

4 hours ago

Gold Wave Analysis – 28 March 2025

Gold: ⬆️ Buy - Gold broke resistance level 3050.00 - Likely to rise to resistance…

4 hours ago

Ethereum Wave Analysis – 28 March 2025

Ethereum: ⬇️ Sell - Ethereum reversed from the resistance level 2120.00 - Likely to fall…

4 hours ago

US inflation accelerates but lags income growth

US PCE inflation exceeded expectations at 2.8% in February. Income growth and savings rates remain…

9 hours ago

What is next: Australia Rate, EU CPI, US NFP

Europe will switch to daylight saving time next week. Key events include the RBA's rate…

11 hours ago