Categories: Technical analysis

GBPCAD Wave Analysis – 27 June, 2019

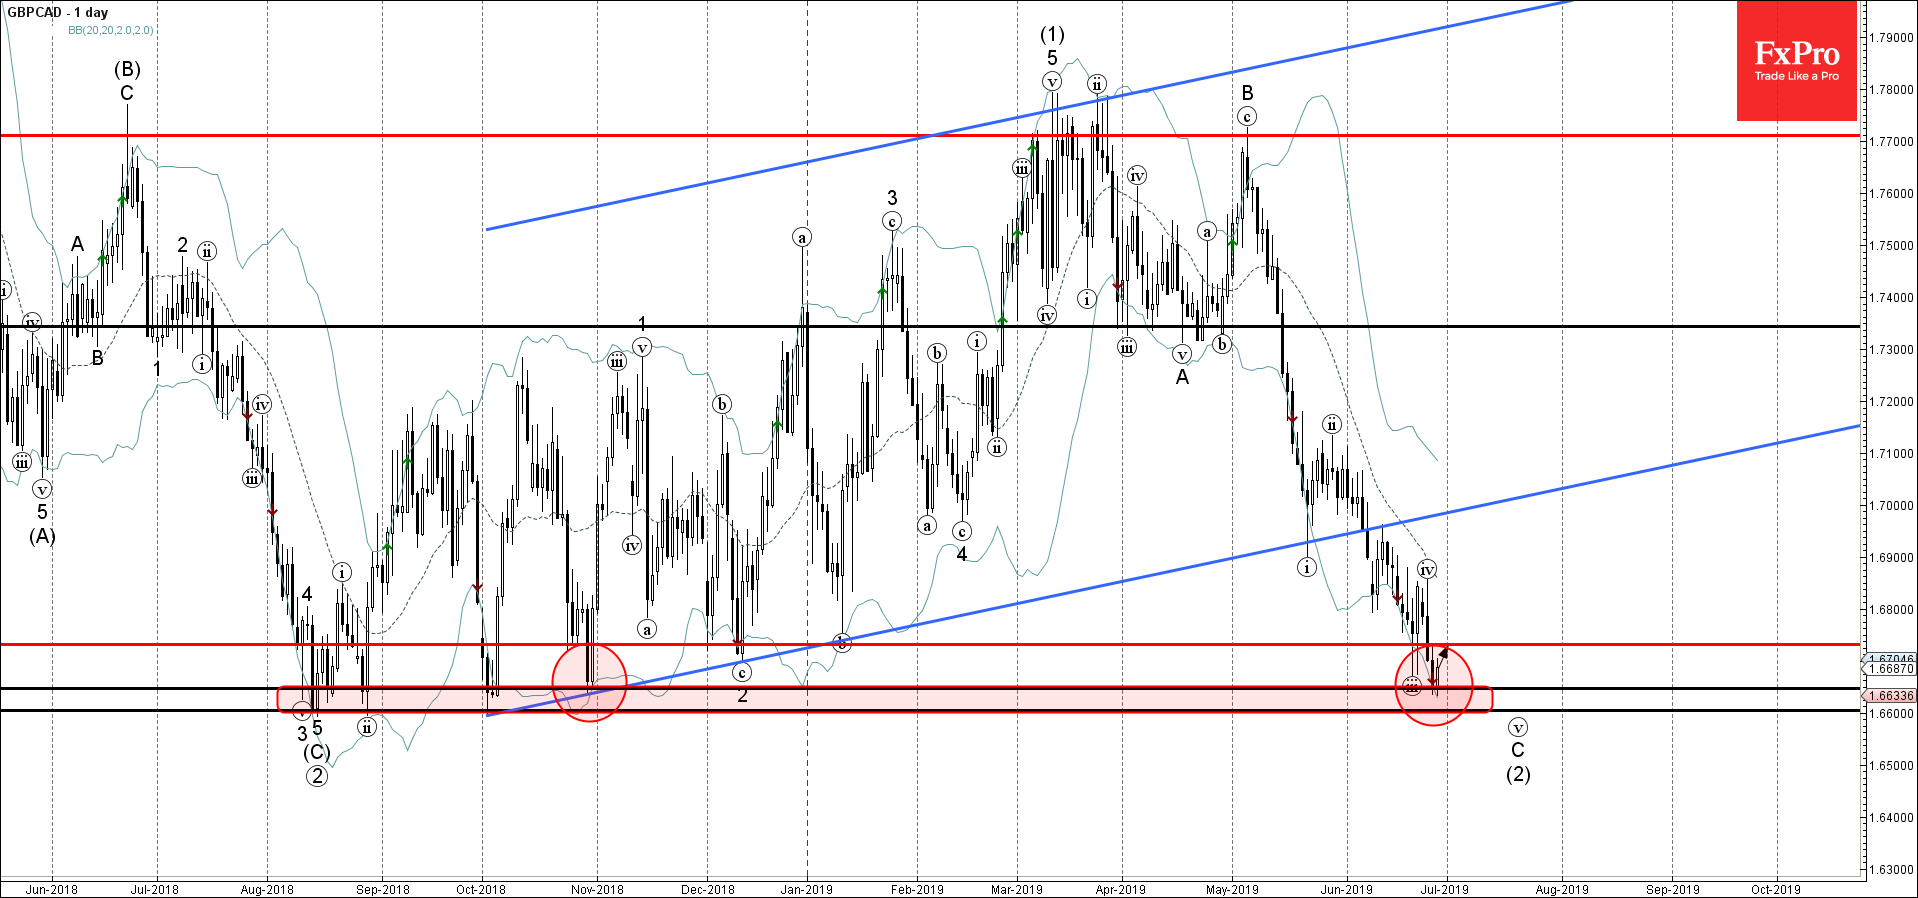
  • GBPCAD reversed from support area
  • Further gains are likely

GBPCAD recently reversed up from the support area lying between the key support level 1.6645 (double bottom from October) and the lower daily Bollinger Band.

The upward reversal from this support area stopped the earlier impulse wave C from May.

GBPCAD is expected to rise further and retest the next resistance level 1.6730 (former support from December).

AddThis Website Tools
The FxPro Tech Analysis Team

The FxPro technical experts prepare a daily analysis of the most active currency pairs (majors, crosses, exotics) and commodities. Selected instruments are reviewed on daily trends (D1, H4), using the active Elliott Wave setups, Japanese candlesticks, indicators, and support/resistance levels.

Share
Published by
The FxPro Tech Analysis Team
Tags: GBPCAD

Recent Posts

Video: Market Shake-Up! Dollar, Bitcoin & Gold on the Move – What’s Next?

Big moves are brewing in the markets! 📉📈 The US Dollar is forming a bottom,…

4 hours ago

Tesla Wave Analysis – 21 March 2025

Tesla: ⬆️ Buy - Tesla reversed from support level 220.00 - Likely to rise to…

3 days ago

Google Wave Analysis – 21 March 2025

Google: ⬆️ Buy - Google reversed from key support level 160.00 - Likely to rise…

3 days ago

Silver Wave Analysis – 21 March 2025

Silver: ⬇️ Sell - Silver reversed from resistance level 34.00 - Likely to fall to…

3 days ago

USDCHF Wave Analysis – 21 March 2025

USDCHF: ⬆️ Buy - USDCHF reversed from support level 0,8750 - Likely to fall to…

3 days ago

What’s next: Flash PMIs, UK CPI & US PCE

The week ahead includes the release of the PMI business activity indexes for March, the…

3 days ago