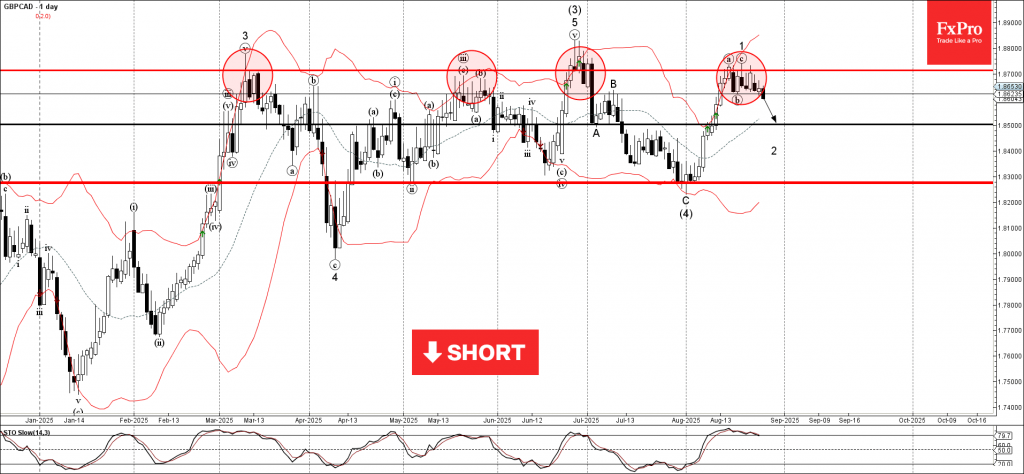
Categories: Technical analysis

GBPCAD Wave Analysis – 27 August 2025

GBPCAD: ⬇️ Sell

– GBPCAD reversed from long-term resistance level 1.8700

– Likely to fall to support level 1.8500.

GBPCAD currency pair recently reversed down from the resistance zone between the upper daily Bollinger Band and the strong multi-month resistance level 1.8700 (which has been reversing the price from March).

The downward reversal from this resistance zone started the active short-term ABC correction 2.

Given the strength of the nearby resistance level 1.8700 and the bullish Canadian dollar sentiment seen today, GBPCAD currency pair can be expected to fall to the next support level 1.8500.

The FxPro Tech Analysis Team

The FxPro technical experts prepare a daily analysis of the most active currency pairs (majors, crosses, exotics) and commodities. Selected instruments are reviewed on daily trends (D1, H4), using the active Elliott Wave setups, Japanese candlesticks, indicators, and support/resistance levels.

Share
Published by
The FxPro Tech Analysis Team
Tags: GBPCAD

Recent Posts

CHFJPY Wave Analysis – 15 January 2026

CHFJPY: ⬇️ Sell - CHFJPY reversed from resistance zone - Likely to fall to support level…

2 hours ago

WTI Crude Oil Wave Analysis – 15 January 2026

WTI Crude Oil: ⬇️ Sell - WTI Crude Oil rising inside minor impulse wave (1) -…

2 hours ago

Costco Wave Analysis – 15 January 2026

Costco: ⬆️ Buy - Costco rising inside minor impulse wave (1) - Likely to reach resistance…

2 hours ago

Chevron Wave Analysis – 15 January 2026

Chevron: ⬆️ Buy - Chevron broke strong resistance level 165.00 - Likely to rise to resistance…

2 hours ago

US Indices: growth widens, but are expectations too high?

Tech sell-off and high Q4 forecasts put the S&P 500 at risk; the Russell 2000…

7 hours ago

Markets pick up signals from the White House

Donald Trump has no intention of dismissing Jerome Powell. The White House's decision to postpone…

10 hours ago

This website uses cookies