Categories: Technical analysis

GBPCAD Wave Analysis 25 March, 2021

• GBPCAD reversed from support zone

• Likely to reach resistance level 1.7400

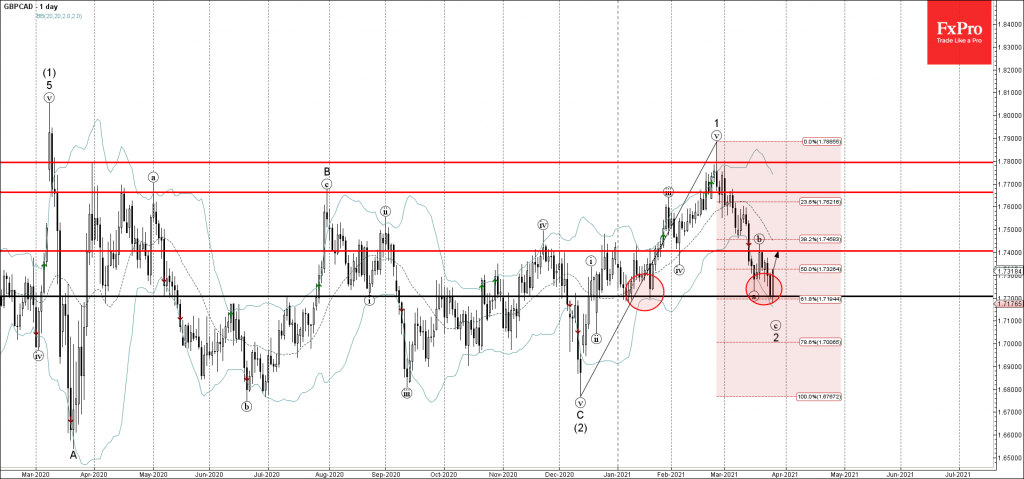
GBPCAD recently reversed up from the support zone lying between support level 1.7200 (which has been reversing the price from January) and the lower daily Bollinger Band.

If the pair closes today near the current levels it will form the daily candlesticks reversal pattern Bullish Engulfing.

GBPCAD is likely to rise further toward the next resistance level 1.7400 (top of the previous minor corrective wave (b)).

AddThis Website Tools
The FxPro Tech Analysis Team

The FxPro technical experts prepare a daily analysis of the most active currency pairs (majors, crosses, exotics) and commodities. Selected instruments are reviewed on daily trends (D1, H4), using the active Elliott Wave setups, Japanese candlesticks, indicators, and support/resistance levels.

Share
Published by
The FxPro Tech Analysis Team
Tags: GBPCAD

Recent Posts

Tesla Wave Analysis – 21 March 2025

Tesla: ⬆️ Buy - Tesla reversed from support level 220.00 - Likely to rise to…

14 hours ago

Google Wave Analysis – 21 March 2025

Google: ⬆️ Buy - Google reversed from key support level 160.00 - Likely to rise…

14 hours ago

Silver Wave Analysis – 21 March 2025

Silver: ⬇️ Sell - Silver reversed from resistance level 34.00 - Likely to fall to…

16 hours ago

USDCHF Wave Analysis – 21 March 2025

USDCHF: ⬆️ Buy - USDCHF reversed from support level 0,8750 - Likely to fall to…

16 hours ago

What’s next: Flash PMIs, UK CPI & US PCE

The week ahead includes the release of the PMI business activity indexes for March, the…

23 hours ago

Gold: Growth Opportunities

Gold has been in an uptrend, reaching record highs and offering growth opportunities. However, caution…

23 hours ago