Categories: Technical analysis

GBPCAD Wave Analysis – 25 August, 2020

• GBPCAD reversed from support area

• Likely to rise to 1.7450

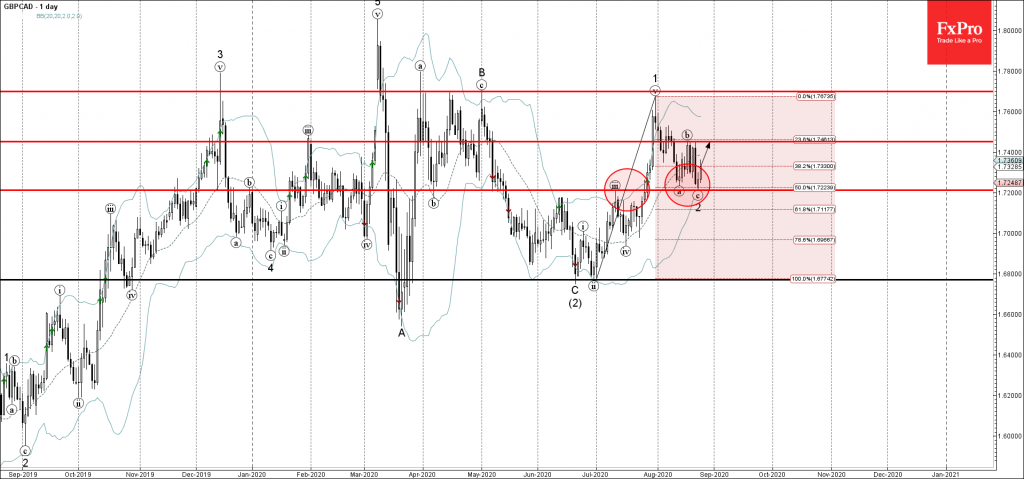
GBPCAD recently corrected up from the support zone lying between the pivotal support level 1.7210 (former resistance from the start of July), lower daily Bollinger Band and the 50% Fibonacci correction of the upward impulse 1 from June.

The upward reversal from this support area stopped the previous minor ABC correction 2.

GBPCAD is likely to rise further toward the next resistance level 1.7450 (top of the (b)-wave of the previous ABC correction 2).

The FxPro Tech Analysis Team

The FxPro technical experts prepare a daily analysis of the most active currency pairs (majors, crosses, exotics) and commodities. Selected instruments are reviewed on daily trends (D1, H4), using the active Elliott Wave setups, Japanese candlesticks, indicators, and support/resistance levels.

Share
Published by
The FxPro Tech Analysis Team
Tags: GBPCAD

Recent Posts

ADP hints at another strong NFP on Friday  

The monthly ADP labour market report showed that America created 192K new jobs in April, above…

3 hours ago

Fed’s hawkish tone risks sinking S&P500 to 4700

Bears showed strength ahead of the FOMC decision.  U.S. indices sagged on Tuesday as investors…

7 hours ago

A new stage of Bitcoin’s decline

Market Picture  Bitcoin's closing price on Tuesday became the lowest since late February, confirming the…

10 hours ago

Ebay Wave Analysis 30 April 2024

- Ebay under the bearish pressure - Likely to fall to support level 51.00 Ebay…

24 hours ago

GBPAUD Wave Analysis 30 April 2024

- GBPAUD reversed from key support level 1.9135 - Likely to rise to resistance level…

24 hours ago

Silver: a possible long road down

Silver has lost 2.6% since the start of the day on Tuesday to $26.4 per…

1 day ago

This website uses cookies