Categories: Technical analysis

GBPCAD Wave Analysis 25 April 2024

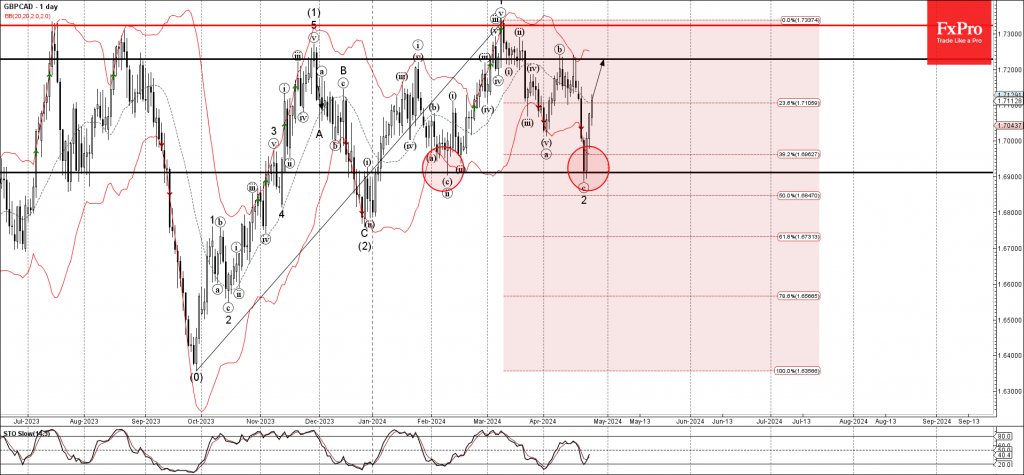
– GBPCAD reversed from key support level 1.6910

– Likely to rise to resistance level 1.7230

GBPCAD currency pair recently reversed up sharply from the key support level 1.6910, (former monthly low from February), standing well below the lower daily Bollinger Band.

The upward reversal from the support level 1.6910 created the strong daily Japanese candlesticks reversal pattern Bullish Engulfing – which stopped the pervious wave 2.

Give the strength of the support level 1.6910, GBPCAD currency pair can be expected to rise further to the next resistance level 1.7230 (which stopped the pervious wave b).

The FxPro Tech Analysis Team

The FxPro technical experts prepare a daily analysis of the most active currency pairs (majors, crosses, exotics) and commodities. Selected instruments are reviewed on daily trends (D1, H4), using the active Elliott Wave setups, Japanese candlesticks, indicators, and support/resistance levels.

Share
Published by
The FxPro Tech Analysis Team
Tags: GBPCAD

Recent Posts

WTI crude oil Wave Analysis 8 May 2024

- WTI crude oil reversed from support area - Likely to rise to resistance level…

14 mins ago

AUDJPY Wave Analysis 8 May 2024

- AUDJPY reversed from support area - Likely to rise to resistance level 103.00 AUDJPY…

15 mins ago

German industrial production slide brings closer ECB’s rate cut

German industrial production continues to decline. The rate of contraction in March was slightly better…

6 hours ago

US indices are heading towards highs

US indices have been gaining daily since the beginning of May. They have found strength…

8 hours ago

Persisting pressure on crypto

Market picture  The crypto market has lost 2% of its capitalisation over the last 24…

12 hours ago

S&P 500 Wave Analysis 7 May 2024

- S&P 500 reversed from support level 5000.00 - Likely to rise to resistance level…

1 day ago

This website uses cookies