Categories: Technical analysis

GBPCAD Wave Analysis 18 February, 2021

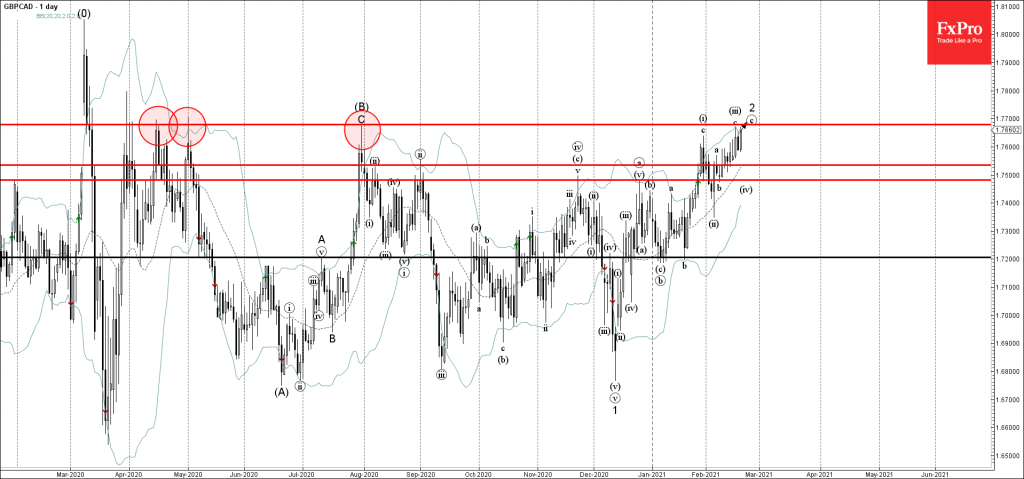
• GBPCAD approached key resistance level 1.7670

• Possible downward correction to 1.7600

GBPCAD has been rising in the last few trading sessions and is currently trading near the key multi-month resistance level 1.7670 (which stopped the previous wave (B) in July as can be seen below).

The resistance area near the resistance level 1.7670 is strengthened by the upper daily Bollinger Band.

If the pair fails today to close above the resistance level 1.7670 – the pair can then fall to the next support level 1.7600.

The FxPro Tech Analysis Team

The FxPro technical experts prepare a daily analysis of the most active currency pairs (majors, crosses, exotics) and commodities. Selected instruments are reviewed on daily trends (D1, H4), using the active Elliott Wave setups, Japanese candlesticks, indicators, and support/resistance levels.

Share
Published by
The FxPro Tech Analysis Team
Tags: GBPCAD

Recent Posts

USDJPY Wave Analysis 26 April 2024

- USDJPY broke key resistance level 155.00 - Likely to rise to resistance level 160.00…

2 days ago

Ebay Wave Analysis 26 April 2024

- Ebay reversed from support level 49.35 - Likely to rise to resistance level 52.55…

2 days ago

False Alert with Yen Interventions?

Even though the Bank of Japan left the key rate and parameters of the QE…

3 days ago

Cooler Bitcoin

Market picture  Market Dynamics: The cryptocurrency market stabilised, losing just 0.1% of capitalisation and dropping to…

3 days ago

GBPCAD Wave Analysis 25 April 2024

- GBPCAD reversed from key support level 1.6910 - Likely to rise to resistance level…

3 days ago

GBPAUD Wave Analysis 25 April 2024

- GBPAUD reversed from support level 1.9135 - Likely to rise to resistance level 1.9360…

3 days ago

This website uses cookies