Categories: Technical analysis

GBPCAD Wave Analysis – 17 February 2023

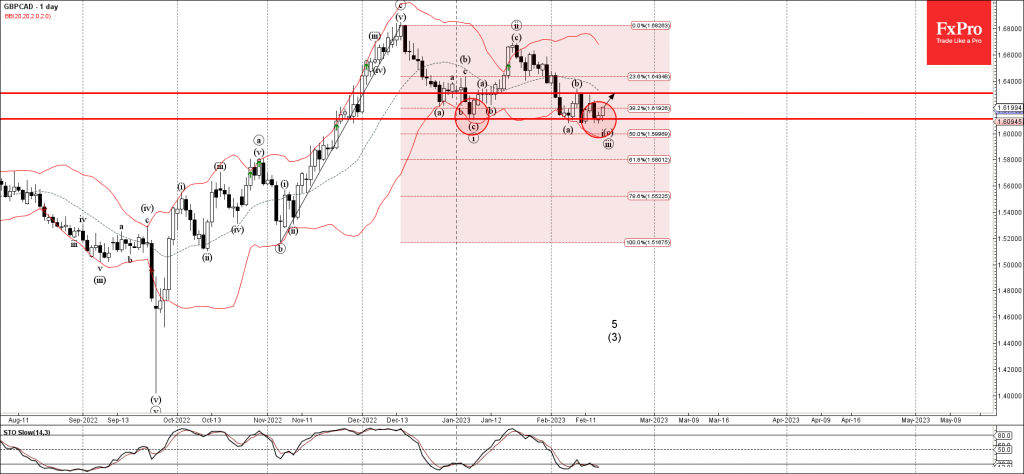
• GBPCAD reversed from key support level 1.6110

• Likely to rise to resistance level 1.63000

GBPCAD previously reversed once again from the key support level 1.6110 (previous monthly low from January) standing near the lower daily Bollinger Band.

The support level 1.6110 was further strengthened by the 50% Fibonacci correction of the previous sharp upward impulse from November.

Given the clear daily uptrend, GBPCAD can be expected to rise further toward the next resistance level 1.6300 (top of the previous wave (b)).

The FxPro Tech Analysis Team

The FxPro technical experts prepare a daily analysis of the most active currency pairs (majors, crosses, exotics) and commodities. Selected instruments are reviewed on daily trends (D1, H4), using the active Elliott Wave setups, Japanese candlesticks, indicators, and support/resistance levels.

Share
Published by
The FxPro Tech Analysis Team
Tags: GBPCAD

Recent Posts

Crude Oil counteracts

Middle East tensions and Venezuelan supply shifts drive Brent crude volatility, with geopolitical risks and…

3 hours ago

Crypto market grows with risk appetite in stocks

Crypto market edges up as risk appetite returns; Bitcoin and Ethereum recover, despite investor caution…

4 hours ago

The yen returned to the Takaichi trade

The dollar resumed its growth after the lawsuit against the Fed chairman. Rumours of early…

5 hours ago

Nat Gas Current situation #tradelikeapro #trading #natgas #tradingstrategy #tradingshorts

Today is Tuesday, the 13th of January, and we will talk about the natural gas…

6 hours ago

Bitcoin Cash Wave Analysis – 12 January 2026

Bitcoin Cash: ⬇️ Sell - Bitcoin Cash reversed from resistance area - Likely to fall…

16 hours ago

EURJPY Wave Analysis – 12 January 2026

EURJPY: ⬆️ Buy - EURJPY reversed from support area - Likely to rise to resistance…

16 hours ago

This website uses cookies