Categories: Technical analysis

GBPCAD Wave Analysis 16 October 2024

– GBPCAD reversed from resistance zone

– Likely to fall to support level 1.7750

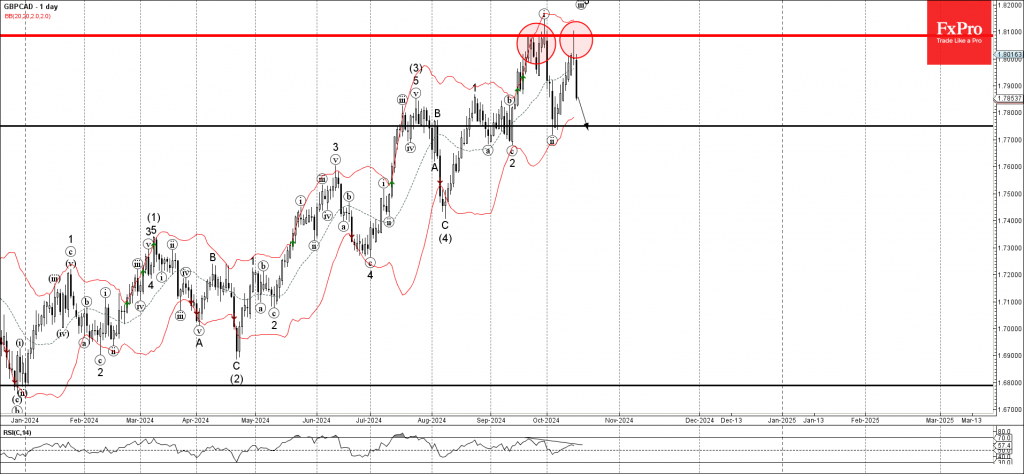
GBPCAD currency pair recently reversed down from the key resistance zone between the strong resistance level 1.8085 (which stopped the previous impulse wave i) and the upper daily Bollinger Band.

The downward reversal from this resistance zone created the well-formed daily Japanese candlesticks reversal pattern Shooting Star Doji.

Given the strength of the resistance level 1.8085 and the bearish divergence on the daily RSI, GBPCAD currency pair  can be expected to fall further to the next support level 1.7750 (former low of wave ii from the start of this month).

The FxPro Tech Analysis Team

The FxPro technical experts prepare a daily analysis of the most active currency pairs (majors, crosses, exotics) and commodities. Selected instruments are reviewed on daily trends (D1, H4), using the active Elliott Wave setups, Japanese candlesticks, indicators, and support/resistance levels.

Share
Published by
The FxPro Tech Analysis Team
Tags: GBPCAD

Recent Posts

CHFJPY Wave Analysis – 9 January 2026

CHFJPY: ⬆️ Buy - CHFJPY reversed from support area - Likely to rise to resistance…

1 day ago

Exxon Mobil Wave Analysis – 9 January 2026

Exxon Mobil: ⬆️ Buy - Exxon Mobil reversed from support area - Likely to rise…

1 day ago

Pro News Weekly: Dollar Rebounds as Markets Test New Limits

Welcome to Pro News Weekly! Here’s what is shaping the markets: 💵 The U.S. dollar…

1 day ago

Geopolitics will destroy the euro

•    EURUSD falls due to geopolitics and expectations of tariff removal •    Gold returns to…

2 days ago

Platinum Wave Analysis – 8 January 2026

Platinum: ⬇️ Sell - Platinum reversed from pivotal resistance level 150.00 - Likely to fall to…

2 days ago

Baidu Wave Analysis – 8 January 2026

Baidu: ⬇️ Sell - Baidu reversed from resistance zone - Likely to fall to support level…

2 days ago

This website uses cookies