Categories: Technical analysis

GBPCAD Wave Analysis – 15 May, 2020

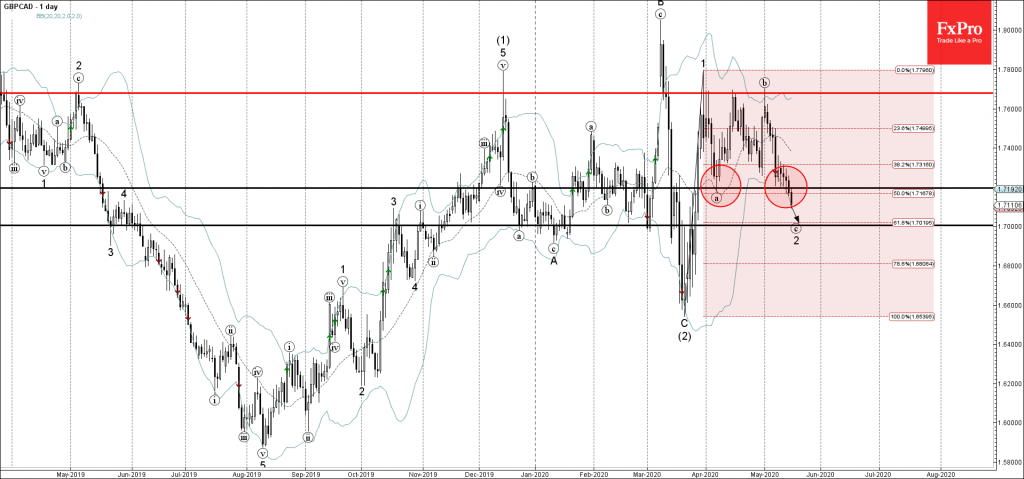
• GBPCAD broke support zone

• Likely to fall to 1.7000

GBPCAD recently broke the support zone lying between the key support level 1.7190 (monthly low from April) and the 50% Fibonacci correction of the previous upward impulse wave 1.

The breakout of this support zone should accelerate the active minor impulse wave (c) of the ABC correction 2 from the end of March.

GBPCAD is likely to fall further toward the next round support level 1.7000 (likely price for the completion of the active wave 2).

The FxPro Tech Analysis Team

The FxPro technical experts prepare a daily analysis of the most active currency pairs (majors, crosses, exotics) and commodities. Selected instruments are reviewed on daily trends (D1, H4), using the active Elliott Wave setups, Japanese candlesticks, indicators, and support/resistance levels.

Share
Published by
The FxPro Tech Analysis Team
Tags: GBPCAD

Recent Posts

German industrial production slide brings closer ECB’s rate cut  

German industrial production continues to decline. The rate of contraction in March was slightly better…

6 hours ago

US indices are heading towards highs

US indices have been gaining daily since the beginning of May. They have found strength…

8 hours ago

Persisting pressure on crypto

Market picture  The crypto market has lost 2% of its capitalisation over the last 24…

11 hours ago

S&P 500 Wave Analysis 7 May 2024

- S&P 500 reversed from support level 5000.00 - Likely to rise to resistance level…

1 day ago

USDCHF Wave Analysis 7 May 2024

- USDCHF reversed from support zone - Likely to rise to resistance level 0.9200 USDCHF…

1 day ago

EURUSD at the equilibrium, where will it go next?

The single currency is trading near $1.076, waiting for further cues and facing serious resistance…

1 day ago

This website uses cookies