Categories: Technical analysis

GBPCAD Wave Analysis 14 October, 2020

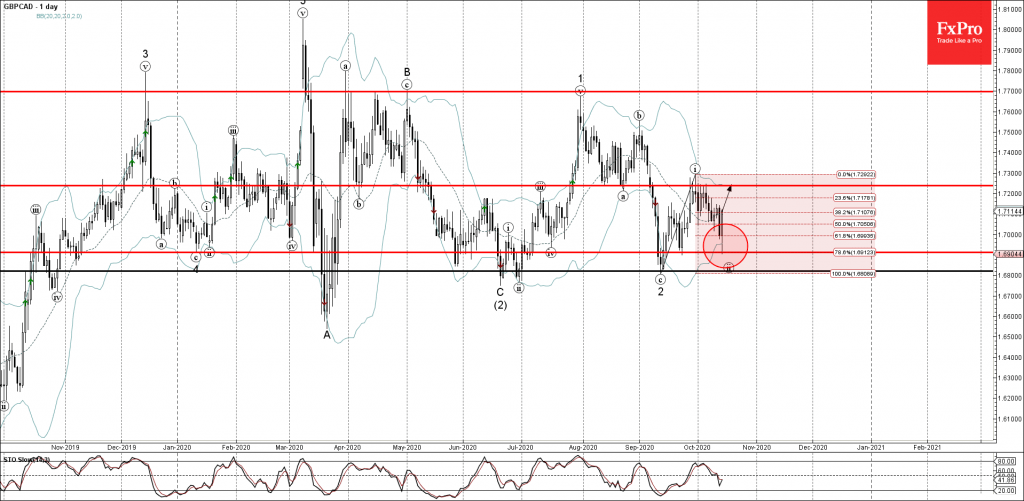
• GBPCAD reversed from support area

• Likely to rise to 1.7240

GBPCAD recently reversed up from the support area located between the previous support pivot from September 1.6910 and the lower daily Bollinger Band.

The upward reversal from this support area is likely to create the daily Japanese candlesticks reversal pattern Piercing Line if the pair closes today near the current levels.

GBPCAD is likely to rise further toward the next resistance level 1.7240 (which reversed the price multiple times from the end of September).

The FxPro Tech Analysis Team

The FxPro technical experts prepare a daily analysis of the most active currency pairs (majors, crosses, exotics) and commodities. Selected instruments are reviewed on daily trends (D1, H4), using the active Elliott Wave setups, Japanese candlesticks, indicators, and support/resistance levels.

Share
Published by
The FxPro Tech Analysis Team
Tags: GBPCAD

Recent Posts

Strong macro data and rate spreads are the USD’s main weapon

Strong US macro data and wide rate spreads boost the dollar, pressuring EURUSD and gold;…

3 hours ago

Top 10 Forex Trading Strategies

We have outlined the 10 best forex trading strategies with clear logic, real-world context, and…

4 hours ago

Bitcoin has not crossed the correction line

Bitcoin holds near $95.5K as the market steadies but hasn't confirmed a exit from correction…

5 hours ago

CHFJPY Wave Analysis – 15 January 2026

CHFJPY: ⬇️ Sell - CHFJPY reversed from resistance zone - Likely to fall to support level…

17 hours ago

WTI Crude Oil Wave Analysis – 15 January 2026

WTI Crude Oil: ⬇️ Sell - WTI Crude Oil rising inside minor impulse wave (1) -…

17 hours ago

Costco Wave Analysis – 15 January 2026

Costco: ⬆️ Buy - Costco rising inside minor impulse wave (1) - Likely to reach resistance…

17 hours ago

This website uses cookies