Categories: Technical analysis

GBPCAD Wave Analysis – 13 February 2023

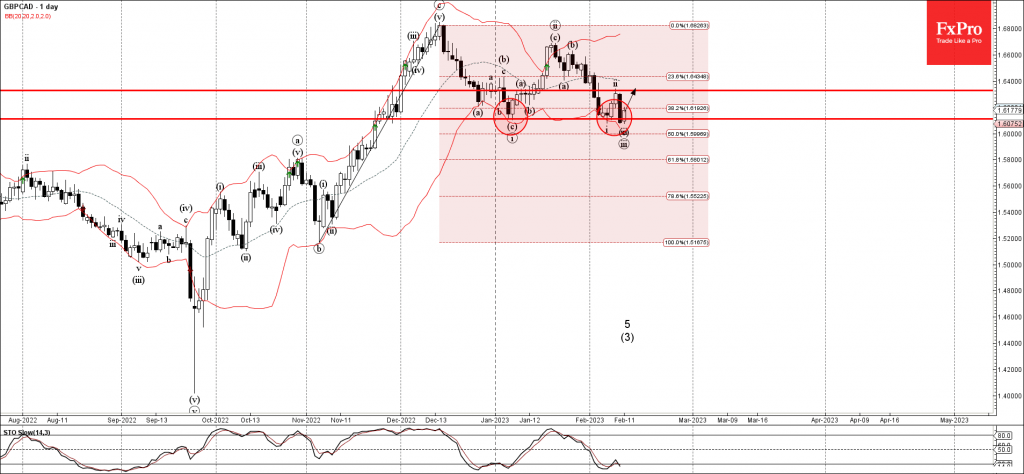
• GBPCAD reversed from key support level 1.6110

• Likely to rise to resistance level 1.6325

GBPCAD currency pair recently reversed up from the key support level 1.6110 (previous monthly low from January), standing near the lower daily Bollinger Band and the 50% Fibonacci correction of the upward impulse from November.

The upward reversal from the support level 1.6110 stopped the previous minor impulse wave (iii).

Given the oversold daily Stochastic, GBPCAD can be expected to rise further toward the next resistance level 1.6325 (top of the previous short-term correction (ii)).

The FxPro Tech Analysis Team

The FxPro technical experts prepare a daily analysis of the most active currency pairs (majors, crosses, exotics) and commodities. Selected instruments are reviewed on daily trends (D1, H4), using the active Elliott Wave setups, Japanese candlesticks, indicators, and support/resistance levels.

Share
Published by
The FxPro Tech Analysis Team
Tags: GBPCAD

Recent Posts

AUDJPY Wave Analysis – 5 December 2025

AUDJPY: ⬆️ Buy - AUDJPY broke long-term resistance level 102.30 - Likely to rise to…

2 hours ago

Aptos Wave Analysis – 5 December 2025

Aptos: ⬇️ Sell - Aptos testing major support at 1.688 - Likely to fall to…

3 hours ago

Pro News Weekly: Market Shake-Up, Dollar Drops, Gold Surges, Bitcoin Wobbles!

Welcome to Pro News Flash! 💵 The U.S. dollar slips 🏆 Major stock indices struggle…

9 hours ago

Solana Wave Analysis – 5 December 2025

Solana: ⬇️ Sell - Solana reversed from resistance zone - Likely to fall to support…

9 hours ago

EURAUD Wave Analysis – 5 December 2025

EURAUD : ⬇️ Sell - EURAUD broke the support level 1.7600 - Likely to fall…

9 hours ago

Forex has set its priorities

In 2026, experts favour the yen, see modest euro growth, and expect pressure on the…

14 hours ago

This website uses cookies