Categories: Technical analysis

GBPCAD Wave Analysis – 12 August, 2020

• GBPCAD broke support level 1.7345

• Likely to fall to 1.7200

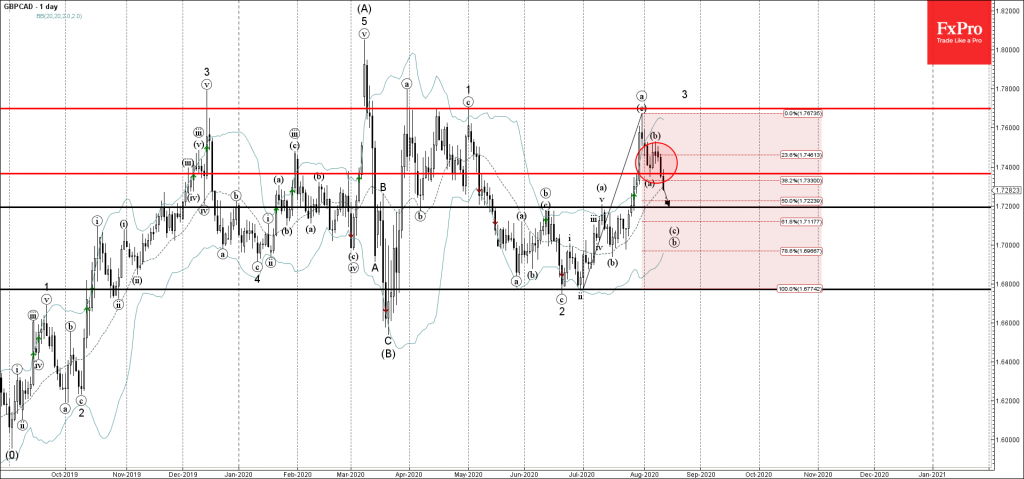
GBPCAD recently broke the support level 1.7345 (low of the previous correction (a)), intersecting with the 38.2% Fibonacci retracement of the previous upward impulse from June.

The breakout of the support level 1.7345 accelerated the active impulse wave (c) of the ABC correction (b) from last month.

GBPCAD is likely to fall further toward the next support level 1.7200 (former resistance level from July).

The FxPro Tech Analysis Team

The FxPro technical experts prepare a daily analysis of the most active currency pairs (majors, crosses, exotics) and commodities. Selected instruments are reviewed on daily trends (D1, H4), using the active Elliott Wave setups, Japanese candlesticks, indicators, and support/resistance levels.

Share
Published by
The FxPro Tech Analysis Team
Tags: GBPCAD

Recent Posts

Crypto Market Retreats Due to Overhang of Sellers

Market picture The crypto market has lost 3.3% in the last 24 hours to $2.3…

3 hours ago

USDJPY Wave Analysis 26 April 2024

- USDJPY broke key resistance level 155.00 - Likely to rise to resistance level 160.00…

3 days ago

Ebay Wave Analysis 26 April 2024

- Ebay reversed from support level 49.35 - Likely to rise to resistance level 52.55…

3 days ago

False Alert with Yen Interventions?

Even though the Bank of Japan left the key rate and parameters of the QE…

3 days ago

Cooler Bitcoin

Market picture  Market Dynamics: The cryptocurrency market stabilised, losing just 0.1% of capitalisation and dropping to…

3 days ago

GBPCAD Wave Analysis 25 April 2024

- GBPCAD reversed from key support level 1.6910 - Likely to rise to resistance level…

4 days ago

This website uses cookies