Categories: Technical analysis

GBPCAD Wave Analysis 11 March 2024

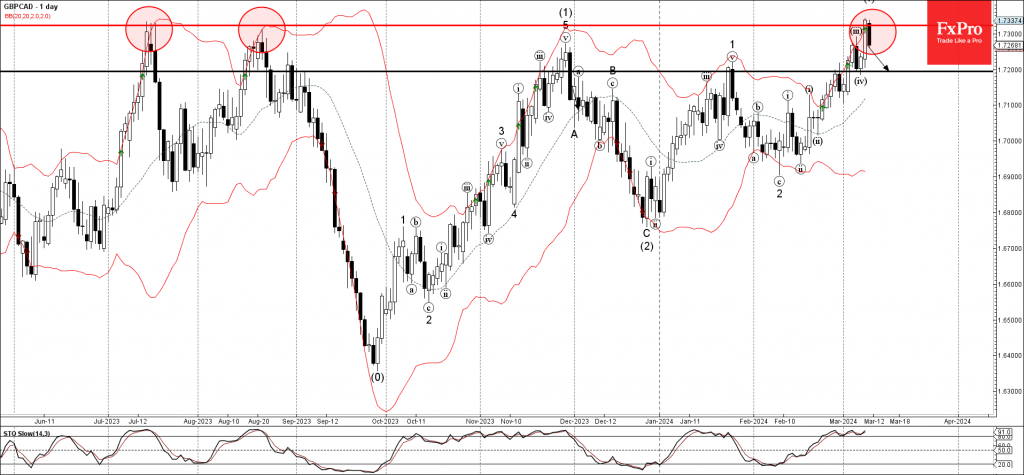
– GBPCAD reversed from resistance level 1.7325

– Likely to fall to support level 1.7200

GBPCAD currency pair today reversed down from the long-term resistance level 1.7325 (which has been reversing the pair from the middle of last year, as can be seen below).

The resistance level 1.7325 was further strengthened by the upper daily and the weekly Bollinger Bands.

Given the strength of the resistance level 1.7325 and the still overbought daily Stochastic indicator,  GBPCAD currency pair can be expected to fall further toward the next support level 1.7200 (low of the previous correction iv).

The FxPro Tech Analysis Team

The FxPro technical experts prepare a daily analysis of the most active currency pairs (majors, crosses, exotics) and commodities. Selected instruments are reviewed on daily trends (D1, H4), using the active Elliott Wave setups, Japanese candlesticks, indicators, and support/resistance levels.

Share
Published by
The FxPro Tech Analysis Team
Tags: GBPCAD

Recent Posts

EURCAD Wave Analysis 6 September 2024

- EURCAD reversed from pivotal support level 1.4900 - Likely to rise to resistance level…

1 day ago

EURUSD Wave Analysis 6 September 2024

- EURUSD reversed from support level 1.1030 - Likely to rise to resistance level 1.1200…

1 day ago

Further Unwinding of Carry Trade

The unwinding of the carry trade in the FX market continues, with the major safe…

1 day ago

Bitcoin pressured by risk-off mood

Market Picture The pressure on risk assets continues, pushing the crypto market capitalisation back below…

2 days ago

AUDUSD Wave Analysis 5 September 2024

- AUDUSD reversed from support level 0.6700 - Likely to rise to resistance level 0.6800…

2 days ago

Gold Wave Analysis 5 September 2024

- Gold reversed from support level 2475.00 - Likely to rise to resistance level 2535.00…

2 days ago

This website uses cookies