Categories: Technical analysis

GBPCAD Wave Analysis 11 December 2024

– GBPCAD reversed from strong resistance zone

– Likely to fall to support level 1.8000

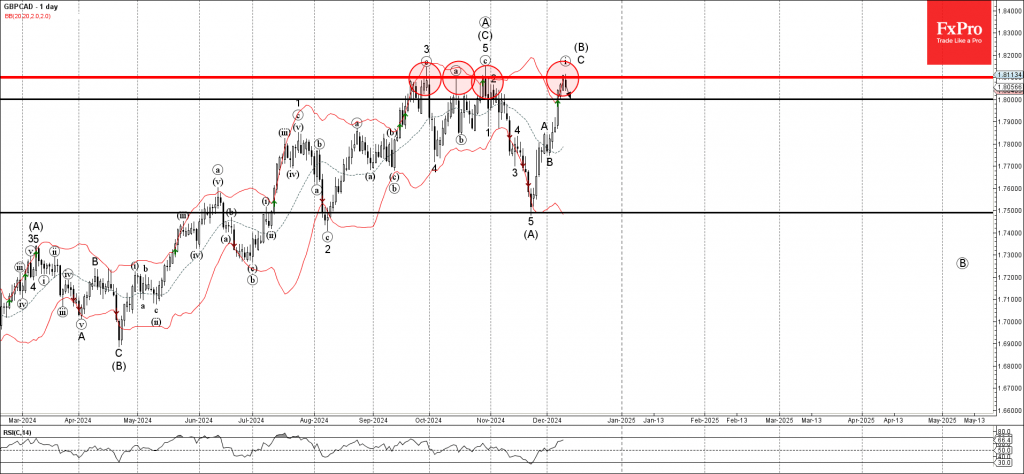
GBPCAD currency pair recently reversed down from the strong resistance zone located at the intersection of the upper daily Bollinger Band and the key resistance level 1.8100, which has been reversing the pair from September.

The downward reversal from this resistance zone stopped the C-wave of the previous ABC correction (B) from the end of November.

Given the strength of the resistance level 1.8100, GBPCAD currency pair can be expected to correct down to the next round support level 1.8000.

The FxPro Tech Analysis Team

The FxPro technical experts prepare a daily analysis of the most active currency pairs (majors, crosses, exotics) and commodities. Selected instruments are reviewed on daily trends (D1, H4), using the active Elliott Wave setups, Japanese candlesticks, indicators, and support/resistance levels.

Share
Published by
The FxPro Tech Analysis Team
Tags: GBPCAD

Recent Posts

Dow Jones Wave Analysis – 17 December 2025

Dow Jones: ⬇️ Sell - Dow Jones reversed from resistance level 49000.00 - Likely to fall…

6 hours ago

Comcast Wave Analysis – 17 December 2025

Comcast: ⬆️ Buy - Comcast broke resistance area - Likely to rise to resistance level 31.00…

6 hours ago

Platinum Wave Analysis – 17 December 2025

Platinum: ⬆️ Buy - Platinum broke resistance level 1800.00 - Likely to rise to resistance…

7 hours ago

Silver Wave Analysis – 17 December 2025

Silver: ⬆️ Buy - Silver broke resistance zone - Likely to rise to resistance level…

7 hours ago

The labour market did not scare the Fed

The Fed is in no hurry to cut rates, and Hassett is unlikely to accelerate…

11 hours ago

The crypto rebound fades with a 40% drop possible

Crypto market faces renewed downward pressure; Bitcoin may drop further, with diverging forecasts for 2026…

13 hours ago

This website uses cookies