Categories: Technical analysis

GBPCAD Wave Analysis – 07 November, 2019

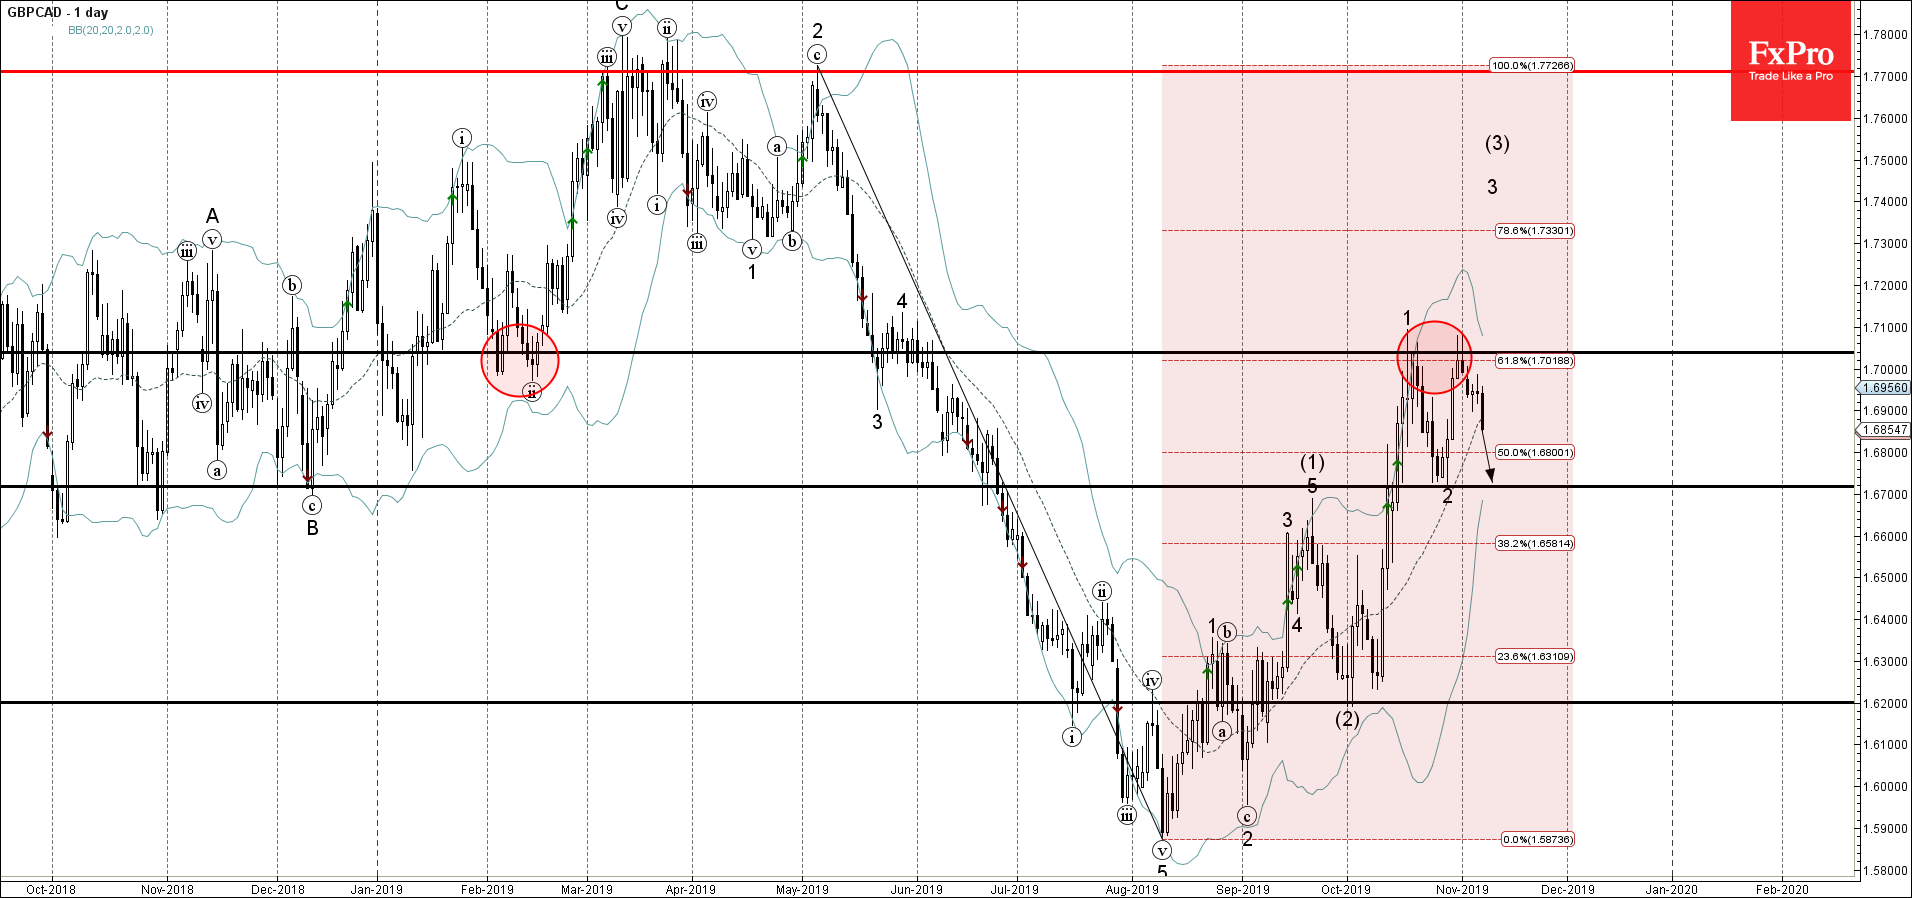
  • GBPCAD reversed from resistance zone
  • Likely to fall to 1.6700

GBPCAD recently reversed down from resistance zone lying between the strong resistance level 1.7040 (top of the previous impulse wave 1), upper daily Bollinger Band and the 61.8% Fibonacci correction of the previous downward impulse from May.

The downward reversal from this resistance area stopped the earlier impulse wave 3 and (3).

GBPCAD is expected to fall further and retest the next support level – 1.6700 (low of the earlier correction 2).

The FxPro Tech Analysis Team

The FxPro technical experts prepare a daily analysis of the most active currency pairs (majors, crosses, exotics) and commodities. Selected instruments are reviewed on daily trends (D1, H4), using the active Elliott Wave setups, Japanese candlesticks, indicators, and support/resistance levels.

Share
Published by
The FxPro Tech Analysis Team
Tags: GBPCAD

Recent Posts

Do not underestimate dollar

Positive macro statistics for the US are helping the greenback. Gold could rise to $4,610…

3 hours ago

Crypto fails to find support for a breakout

Crypto markets fell amid caution; Bitcoin and Ethereum face technical and investor shifts, with privacy…

4 hours ago

SP500. Current situation #sp500 #tradelikeapro #trading #trandingshorts #tradingstrategy #fxpro

Today is Thursday, January 8th, and we continue talking about the markets. Today, we will…

5 hours ago

NZDCAD Wave Analysis – 7 January 2026

NZDCAD: ⬆️ Buy - NZDCAD reversed from support zone - Likely to rise to resistance…

18 hours ago

Bitcoin Wave Analysis – 7 January 2026

Bitcoin: ⬇️ Sell - Bitcoin reversed from resistance zone - Likely to fall to support…

18 hours ago

EURGBP Wave Analysis – 7 January 2026

EURGBP: ⬆️ Buy - EURGBP reversed from support zone - Likely to rise to resistance…

18 hours ago

This website uses cookies