Categories: Technical analysis

GBPCAD Wave Analysis – 03 April, 2020

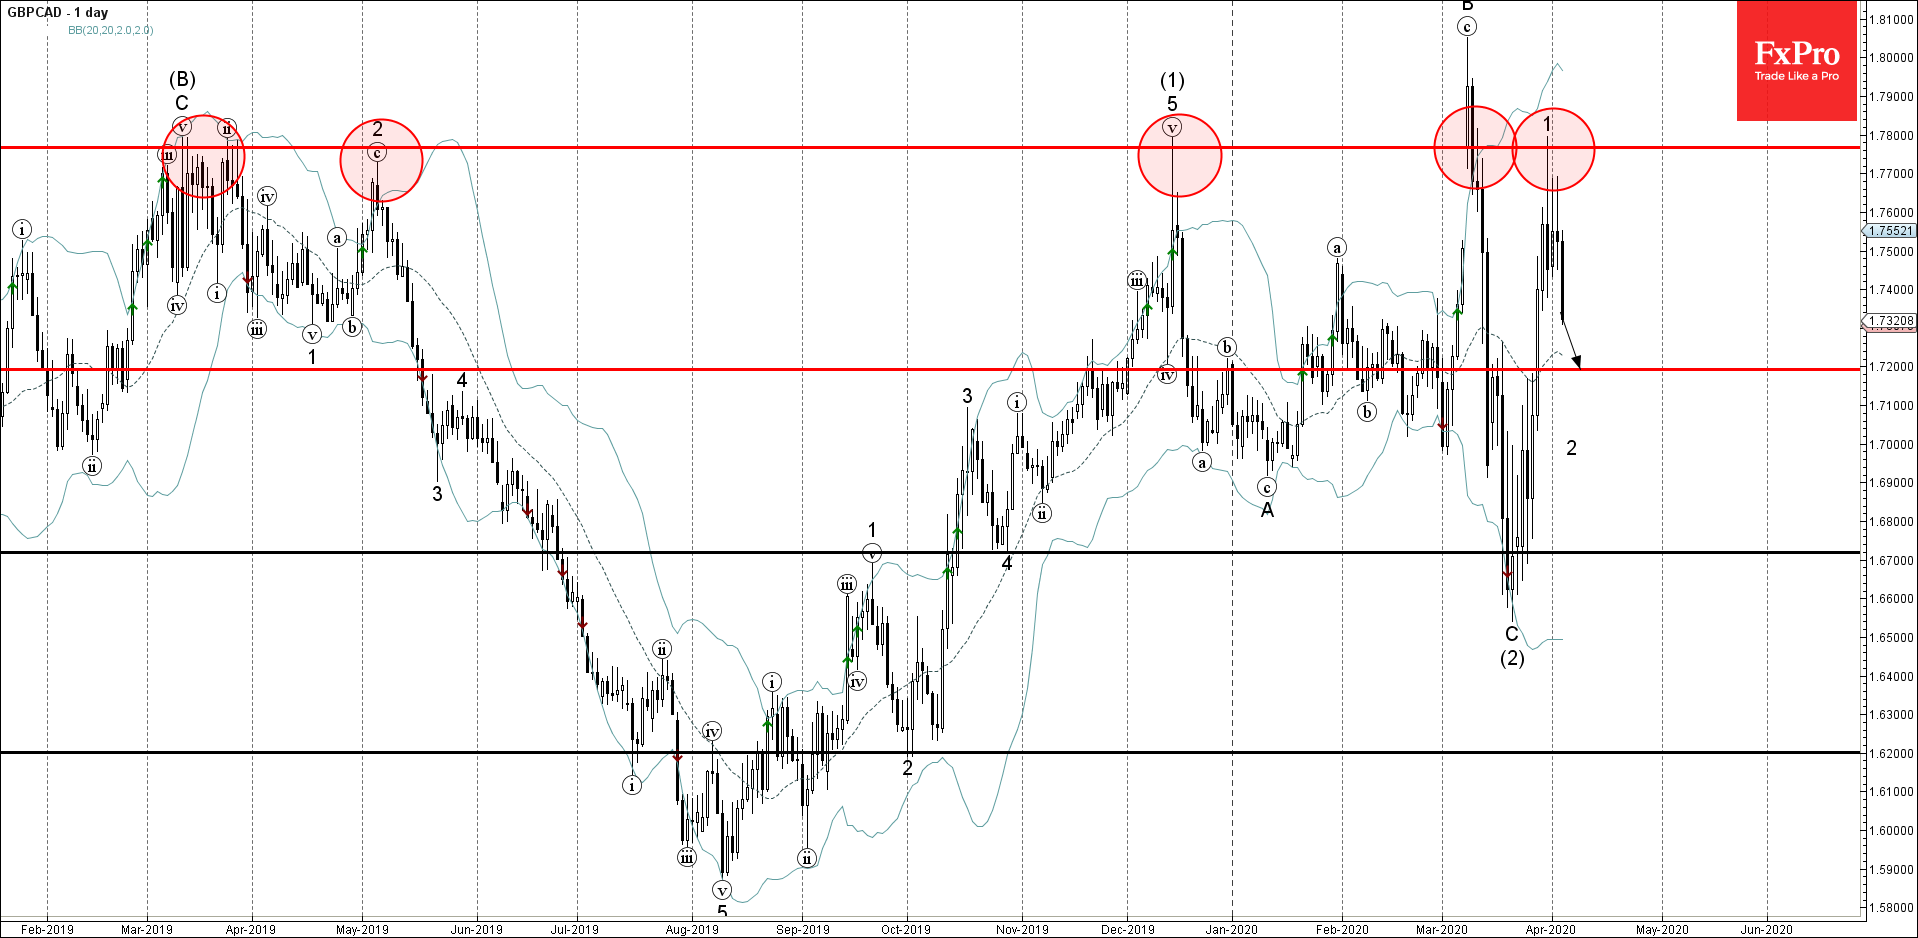
  • GBPCAD reversed from resistance level 1.7770
  • Likely to fall to 1.7200

GBPCAD recently reversed down from the resistance level 1.7770 (which has been reversing the price from March of 2019, as can be seen below).

The resistance area near the resistance level 1.7770 was strengthened by the upper daily Bollinger Band.

GBPCAD is likely to fall further in the active short-term correction 2 toward the next support level 1.7200.

AddThis Website Tools
The FxPro Tech Analysis Team

The FxPro technical experts prepare a daily analysis of the most active currency pairs (majors, crosses, exotics) and commodities. Selected instruments are reviewed on daily trends (D1, H4), using the active Elliott Wave setups, Japanese candlesticks, indicators, and support/resistance levels.

Share
Published by
The FxPro Tech Analysis Team
Tags: GBPCAD

Recent Posts

NIO Wave Analysis – 31 March 2025

NIO: ⬆️ Buy - NIO reversed from support zone - Likely to rise to resistance…

6 hours ago

Nvidia Wave Analysis – 31 March 2025

Nvidia: ⬆️ Buy - Nvidia reversed from key support level 105.00 - Likely to rise…

6 hours ago

Markets rattled on consumer sentiment

Consumer sentiment index from the University of Michigan shows alarming information for stock indices, with…

13 hours ago

EURAUD Wave Analysis – 31 March 2025

EURAUD: ⬆️ Buy - EURAUD rising inside impulse wave iii - Likely to reach resistance…

13 hours ago

USDCAD Wave Analysis – 31 March 2025

USDCAD: ⬆️ Buy - USDCAD reversed from the support zone - Likely to rise to…

13 hours ago

Video Pro News Weekly: Market Shake-Up. USD Struggles & Crypto’s Next Big Move!

Major market shifts underway! The US dollar hits resistance, stocks teeter on tariff tensions, and…

18 hours ago