Categories: Technical analysis

GBPAUD Wave Analysis – 9 June, 2020

• GBPAUD under bullish pressure

• Likely to rise to 1.8400

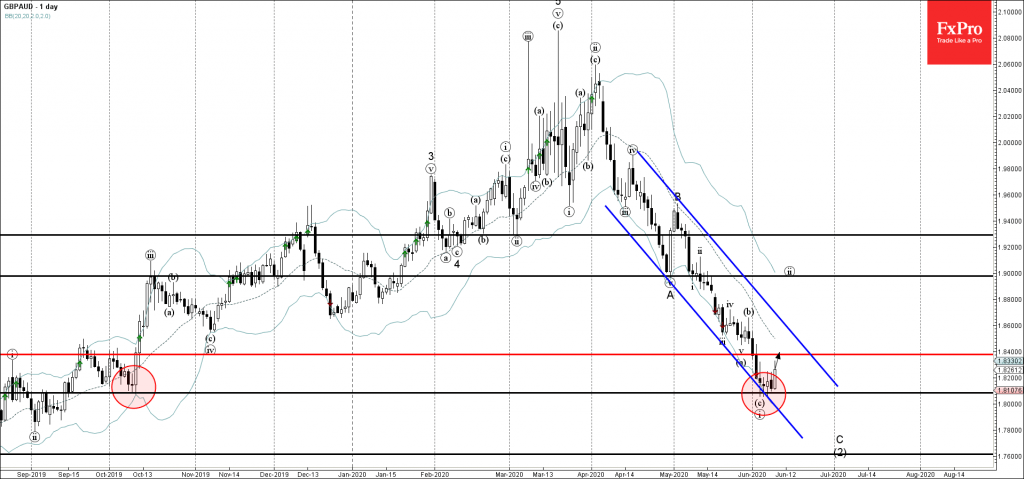
GBPAUD under bullish pressure after the earlier upward reversal from the support area lying between the key support level 1.8080 (former monthly low from October of 2019) and the lower daily Bollinger Band.

This support area was further strengthened by the lower support trendline of the daily down channel from the middle of April.

GBPAUD is likely to rise further in the active short-term corrective wave (ii) toward the next resistance level 1.8400.

The FxPro Tech Analysis Team

The FxPro technical experts prepare a daily analysis of the most active currency pairs (majors, crosses, exotics) and commodities. Selected instruments are reviewed on daily trends (D1, H4), using the active Elliott Wave setups, Japanese candlesticks, indicators, and support/resistance levels.

Share
Published by
The FxPro Tech Analysis Team
Tags: GBPAUD

Recent Posts

EURUSD at the equilibrium, where will it go next? 

The single currency is trading near $1.076, waiting for further cues and facing serious resistance…

4 hours ago

Bitcoin can’t accelerate but won’t give up trying

Market picture  The crypto market capitalisation fell by 1.7% in 24 hours to $2.29 trillion,…

9 hours ago

USDJPY Wave Analysis 6 May 2024

- USDJPY reversed from support zone - Likely to rise to resistance level 155.65 USDJPY…

24 hours ago

Gold Wave Analysis 6 May 2024

- Gold reversed from support zone - Likely to rise to resistance level 2400.00 Gold…

24 hours ago

Oil Bounces Locally, Global Support 5% below Spot Price

The number of operating oil rigs in the US fell by 7 to 499. This…

1 day ago

Crypto Market Tries to Break Local Downtrend

Market picture  Crypto market capitalisation has been up 2% over the past seven days and…

1 day ago

This website uses cookies