Categories: Technical analysis

GBPAUD Wave Analysis 27 November 2024

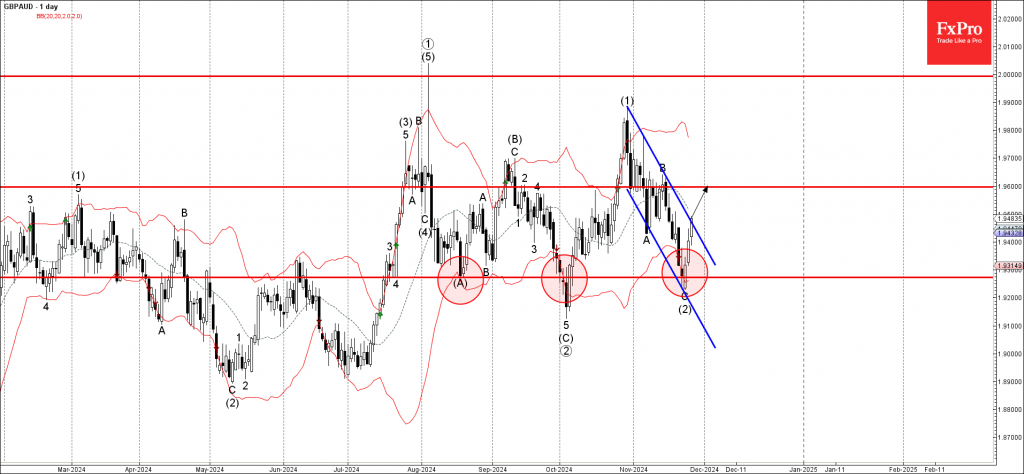
– GBPAUD broke daily down channel

– Likely to rise to resistance level 1.9600

GBPAUD currency pair today broke the resistance trendline of the daily down channel from the end of October (which encloses the earlier downward ABC correction (2) – which stopped earlier at the support level 1.9275).

The breakout of this down channel should accelerate the active impulse wave (3) – which belongs to the higher order impulse wave 3 from October.

GBPAUD currency pair can be expected to rise to the next resistance level 1.9600 (former top of wave B of the previous ABC correction (2)).

AddThis Website Tools
The FxPro Tech Analysis Team

The FxPro technical experts prepare a daily analysis of the most active currency pairs (majors, crosses, exotics) and commodities. Selected instruments are reviewed on daily trends (D1, H4), using the active Elliott Wave setups, Japanese candlesticks, indicators, and support/resistance levels.

Share
Published by
The FxPro Tech Analysis Team
Tags: GBPAUD

Recent Posts

Video: Dollar and Indices are trying to find footing after the fall

The dollar experienced a sell-off but rallied back up by the end of the week.…

1 day ago

What is next: BoJ, Fed, SNB & BoE Rates

The new week will be packed with economic data and decisions from key central banks.…

1 day ago

Dollar attempts to rebound after oversold conditions

Despite economic factors working against the dollar, its oversold condition helped it this week or…

1 day ago

USDCAD Wave Analysis – 14 March 2025

USDCAD: ⬇️ Sell - USDCAD reversed from key resistance level 1.4500 - Likely to fall…

1 day ago

Solana Wave Analysis – 14 March 2025

Solana: ⬆️ Buy - Solana reversed from the long-term support level 113.75 - Likely to…

1 day ago

Adobe Wave Analysis – 13 March 2025

Adobe: ⬇️ Sell - Adobe broke round support level 400.00 - Likely to fall to…

2 days ago