Categories: Technical analysis

GBPAUD Wave Analysis – 26 November, 2019

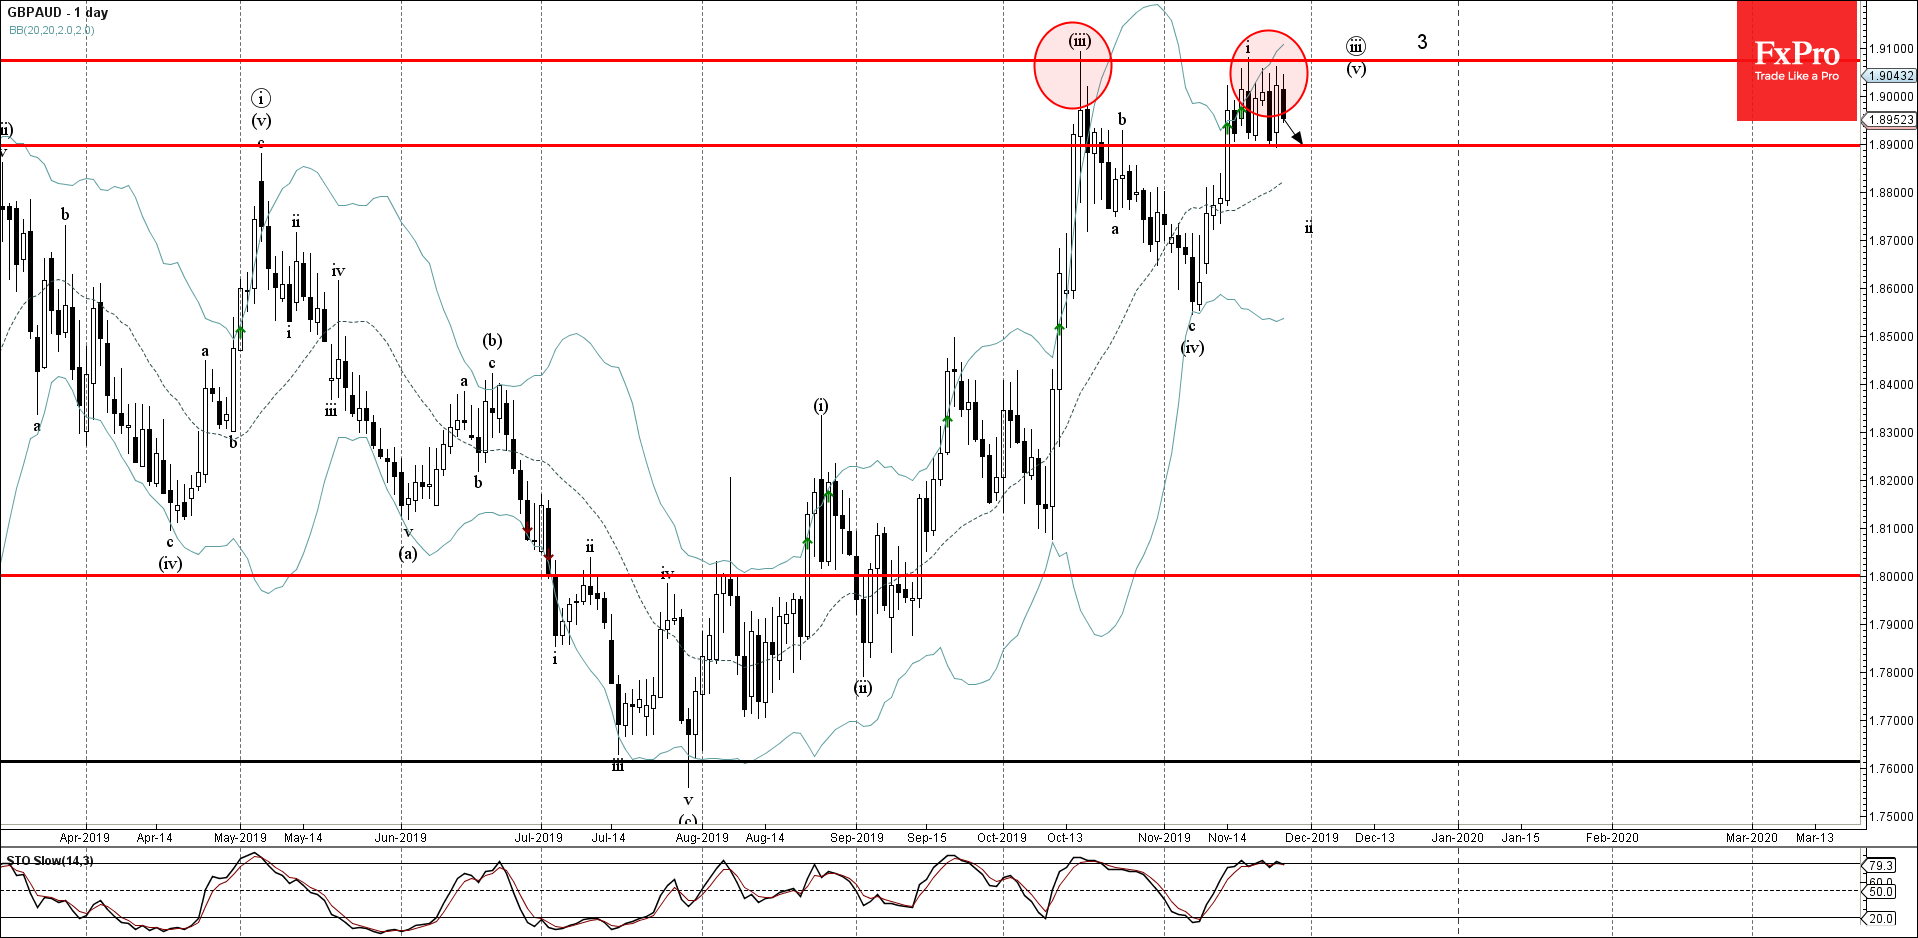
  • GBPAUD reversed from resistance level 1.9070
  • Likely to fall to 1.8900

GBPAUD recently reversed down from the resistance level 1.9070 (monthly high from October) – strengthened by the upper daily Bollinger Band.

The downward reversal from the resistance level 1.9070 started the active short-term corrective wave (ii).

GBPAUD is expected to fall further toward the next support level 1.8900 (low of the previous reversal pattern Bullish Engulfing).

The FxPro Tech Analysis Team

The FxPro technical experts prepare a daily analysis of the most active currency pairs (majors, crosses, exotics) and commodities. Selected instruments are reviewed on daily trends (D1, H4), using the active Elliott Wave setups, Japanese candlesticks, indicators, and support/resistance levels.

Share
Published by
The FxPro Tech Analysis Team
Tags: GBPAUD

Recent Posts

USDJPY Wave Analysis 26 April 2024

- USDJPY broke key resistance level 155.00 - Likely to rise to resistance level 160.00…

12 hours ago

Ebay Wave Analysis 26 April 2024

- Ebay reversed from support level 49.35 - Likely to rise to resistance level 52.55…

12 hours ago

False Alert with Yen Interventions?

Even though the Bank of Japan left the key rate and parameters of the QE…

20 hours ago

Cooler Bitcoin

Market picture  Market Dynamics: The cryptocurrency market stabilised, losing just 0.1% of capitalisation and dropping to…

24 hours ago

GBPCAD Wave Analysis 25 April 2024

- GBPCAD reversed from key support level 1.6910 - Likely to rise to resistance level…

2 days ago

GBPAUD Wave Analysis 25 April 2024

- GBPAUD reversed from support level 1.9135 - Likely to rise to resistance level 1.9360…

2 days ago

This website uses cookies