Categories: Technical analysis

GBPAUD Wave Analysis – 19 November, 2019

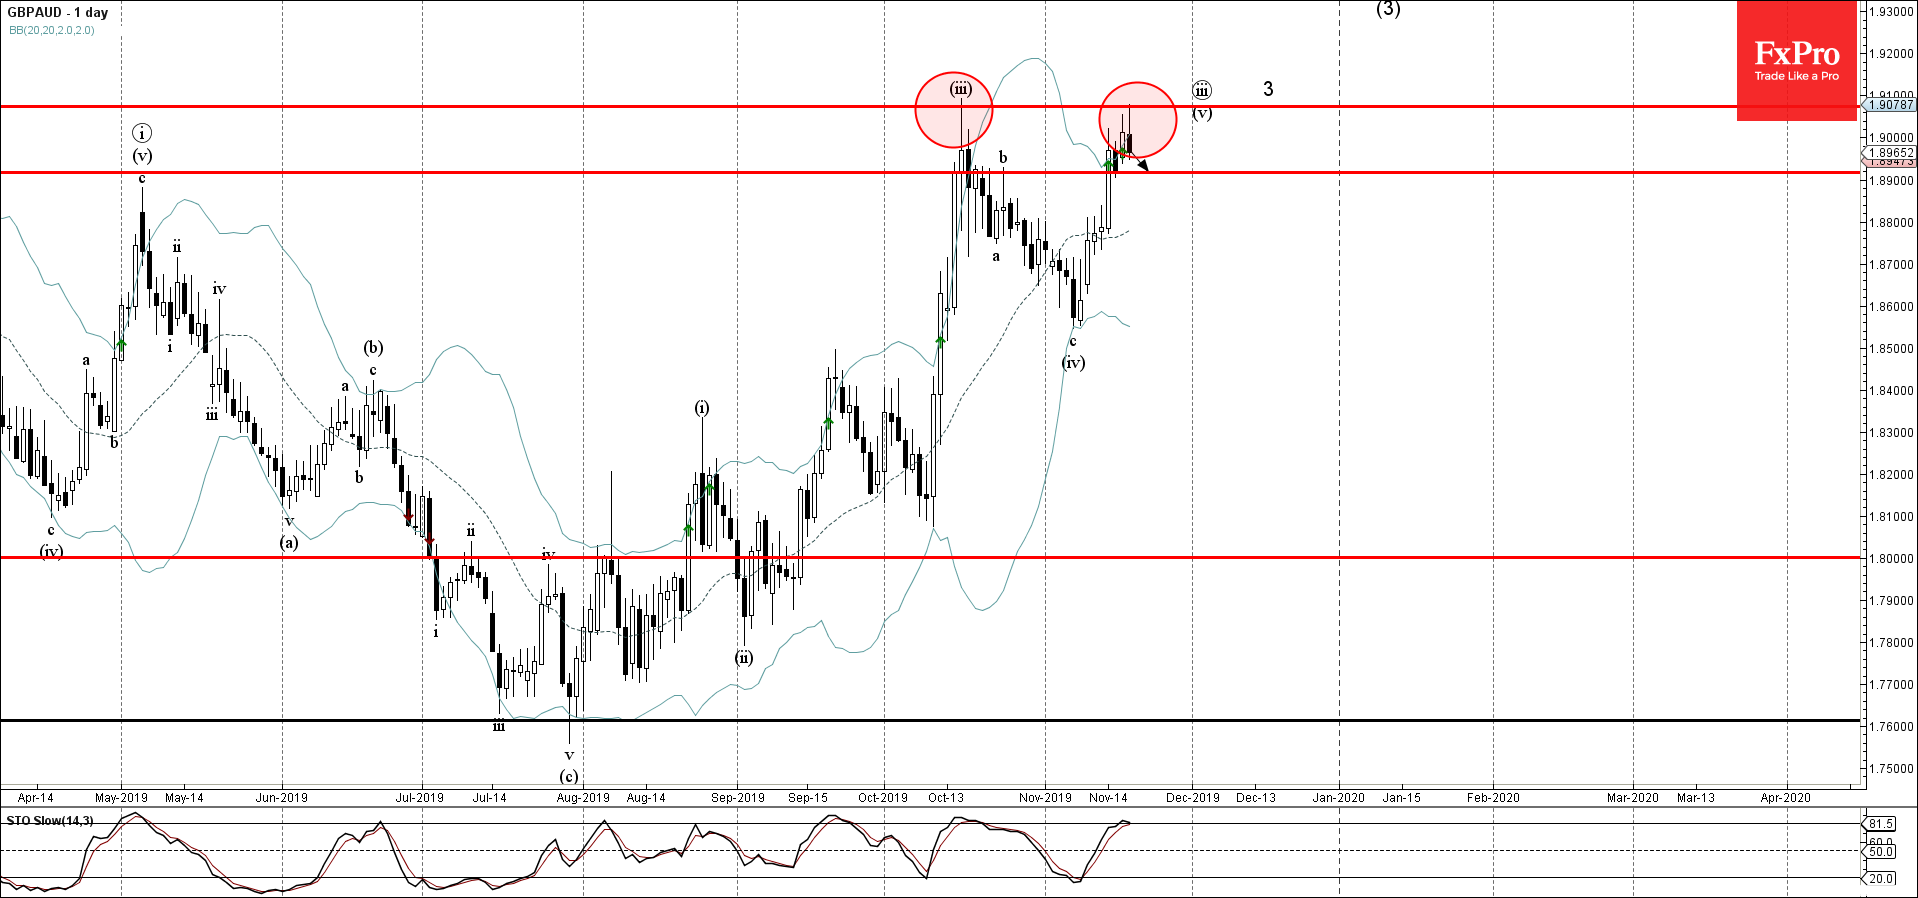
  • GBPAUD reversed from key resistance area
  • Likely to fall to 1.8920

GBPAUD recently reversed down from the key resistance area lying between the resistance level 1.9070 (monthly high from October) and the upper daily Bollinger Band.

The downward reversal from this resistance area stopped the previous impulse waves 3 and (3).

Given the overbought daily Stochastic – GBPAUD is expected to fall further toward the next support level 1.8920 (top of the previous wave (b) from October)

The FxPro Tech Analysis Team

The FxPro technical experts prepare a daily analysis of the most active currency pairs (majors, crosses, exotics) and commodities. Selected instruments are reviewed on daily trends (D1, H4), using the active Elliott Wave setups, Japanese candlesticks, indicators, and support/resistance levels.

Share
Published by
The FxPro Tech Analysis Team
Tags: GBPAUD

Recent Posts

EURJPY Wave Analysis – 31 December 2025

EURJPY: ⬆️ Buy - EURJPY reversed from support area - Likely to rise to resistance…

1 day ago

Binance Coin Wave Analysis – 31 December 2025

Binance Coin: ⬆️ Buy - Binance Coin broke Descending Triangle - Likely to rise to…

1 day ago

Uniswap Wave Analysis – 31 December 2025

Uniswap: ⬇️ Sell - Uniswap reversed from resistance area - Likely to fall to support…

1 day ago

S&P 500 Wave Analysis – 31 December 2025

S&P 500: ⬇️ Sell - S&P 500 reversed from strong resistance level 6935.00 - Likely…

1 day ago

The dollar may defy expectations

•  The return of American exceptionalism will help the greenback. •  The yen will start…

1 day ago

Stellar Wave Analysis – 30 December 2025

Stellar: ⬇️ Sell - Stellar reversed from resistance area - Likely to fall to support…

2 days ago

This website uses cookies