Categories: Technical analysis

GBPAUD Wave Analysis 12 April 2024

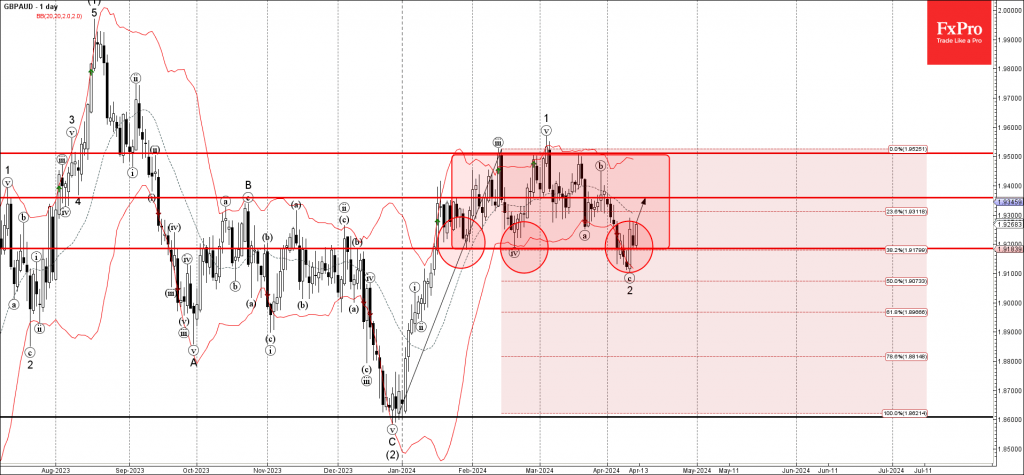
– GBPAUD reversed from support level 1.918

– Likely to rise to resistance level 1.9360

GBPAUD recently reversed up from the key support level 1.918 (which has been reversing the price from January).

The support level 1.918 was strengthened by the lower daily Bollinger Band and by the 38.2% Fibonacci correction of the upward impulse from December.

GBPAUD can be expected to rise further to the next resistance level 1.9360 (middle of the sideways price range inside which the pair has been moving from January).

The FxPro Tech Analysis Team

The FxPro technical experts prepare a daily analysis of the most active currency pairs (majors, crosses, exotics) and commodities. Selected instruments are reviewed on daily trends (D1, H4), using the active Elliott Wave setups, Japanese candlesticks, indicators, and support/resistance levels.

Share
Published by
The FxPro Tech Analysis Team

Recent Posts

Crypto market shakes off consolidation

Market picture The release of US inflation data sparked a surge in risk asset purchases,…

7 hours ago

Gold Wave Analysis – 15 May, 2024

• Gold broke daily down channel • Likely to reach resistance level 2415.00 Gold recently…

24 hours ago

AUDUSD Wave Analysis – 15 May, 2024

• AUDUSD broke key resistance level 0.6650 • Likely to reach resistance level 0.6760 AUDUSD…

24 hours ago

EURUSD is trying to break the 5-month downtrend

The US dollar has been under relentless pressure since last Thursday, approaching more than one-month…

1 day ago

Matured altcoins are losing strength

Market Picture Neither the meme mania in equities, the overall positivity in stock indices, nor…

1 day ago

EURCHF Wave Analysis – 14 May, 2024

• EURCHF rising inside impulse wave 3 • Likely to reach resistance level 0.9835 EURCHF…

2 days ago

This website uses cookies