Categories: Technical analysis

GBPAUD Wave Analysis – 11 October, 2019

  • GBPAUD broke resistance zone
  • Likely to rise to 1.8800

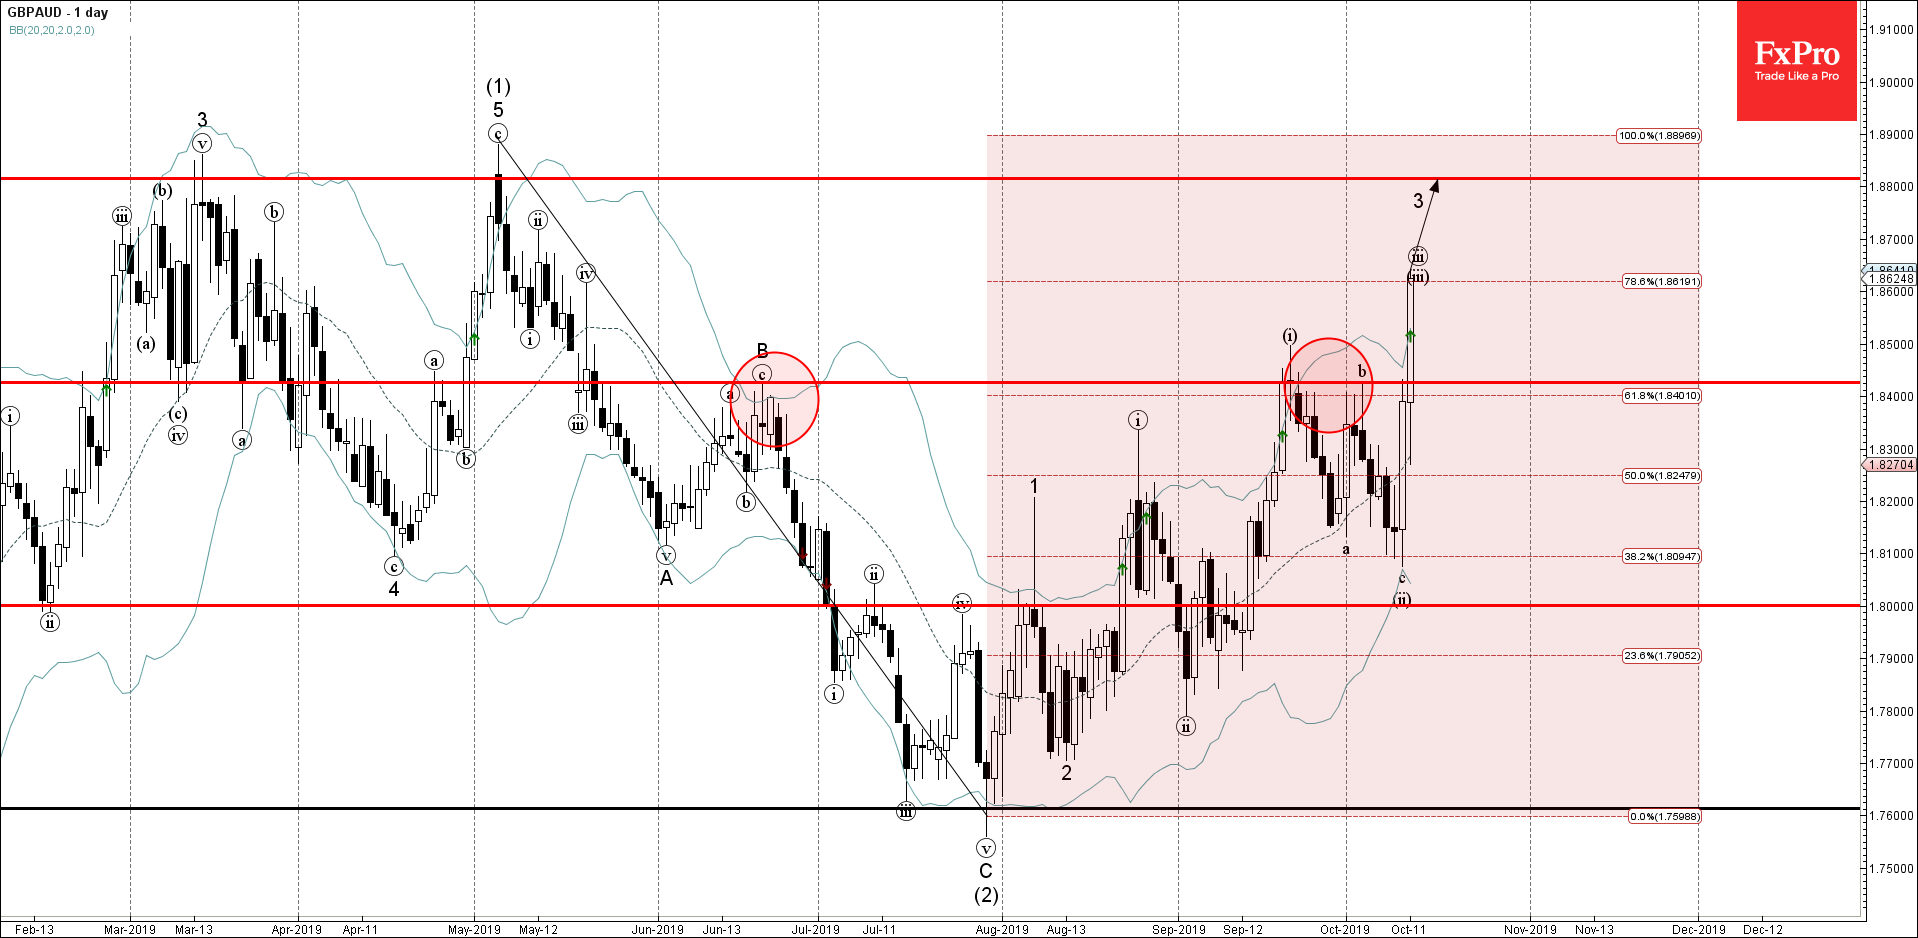
GBPAUD recently broke the resistance zone lying between the key resistance level 1.8430 and the 61.8% Fibonacci correction of the previous downward wave 2 from May.

The breakout of this resistance zone continues the active short-term impulse wave 3 – which belongs to the impulse wave (3) from July.

GBPAUD is expected to rise further and retest the next resistance level 1.8800 (target price calculated for the completion of the active short-term impulse wave 3).

The FxPro Tech Analysis Team

The FxPro technical experts prepare a daily analysis of the most active currency pairs (majors, crosses, exotics) and commodities. Selected instruments are reviewed on daily trends (D1, H4), using the active Elliott Wave setups, Japanese candlesticks, indicators, and support/resistance levels.

Share
Published by
The FxPro Tech Analysis Team
Tags: GBPAUD

Recent Posts

EURNZD Wave Analysis – 17 March 2025

EURNZD: ⬇️ Sell - EURNZD reversed from long-term resistance level 1.9160 - Likely to fall…

1 hour ago

AUDUSD Wave Analysis – 17 March 2025

AUDUSD: ⬆️ Buy - AUDUSD broke resistance level 0.6350 - Likely to rise to resistance…

1 hour ago

Weak US retail sales might boost stocks

Weak US retail sales are adding to concerns of a potential recession, putting pressure on…

3 hours ago

Dow Jones: Rebound or Rally? The Fed Holds the Key

The Dow Jones rebound depends on the Federal Reserve's monetary policy and incoming data. It…

4 hours ago

Crypto market fails to confirm reversal

Market Picture The crypto market is consolidating in the $2.70 trillion area, near the bottom…

9 hours ago

Video: Dollar and Indices are trying to find footing after the fall

The dollar experienced a sell-off but rallied back up by the end of the week.…

3 days ago

This website uses cookies