Categories: Technical analysis

GBPAUD Wave Analysis – 29 November , 2018

  • GBPAUD broke key support level 1.7500
  • Further losses are likely

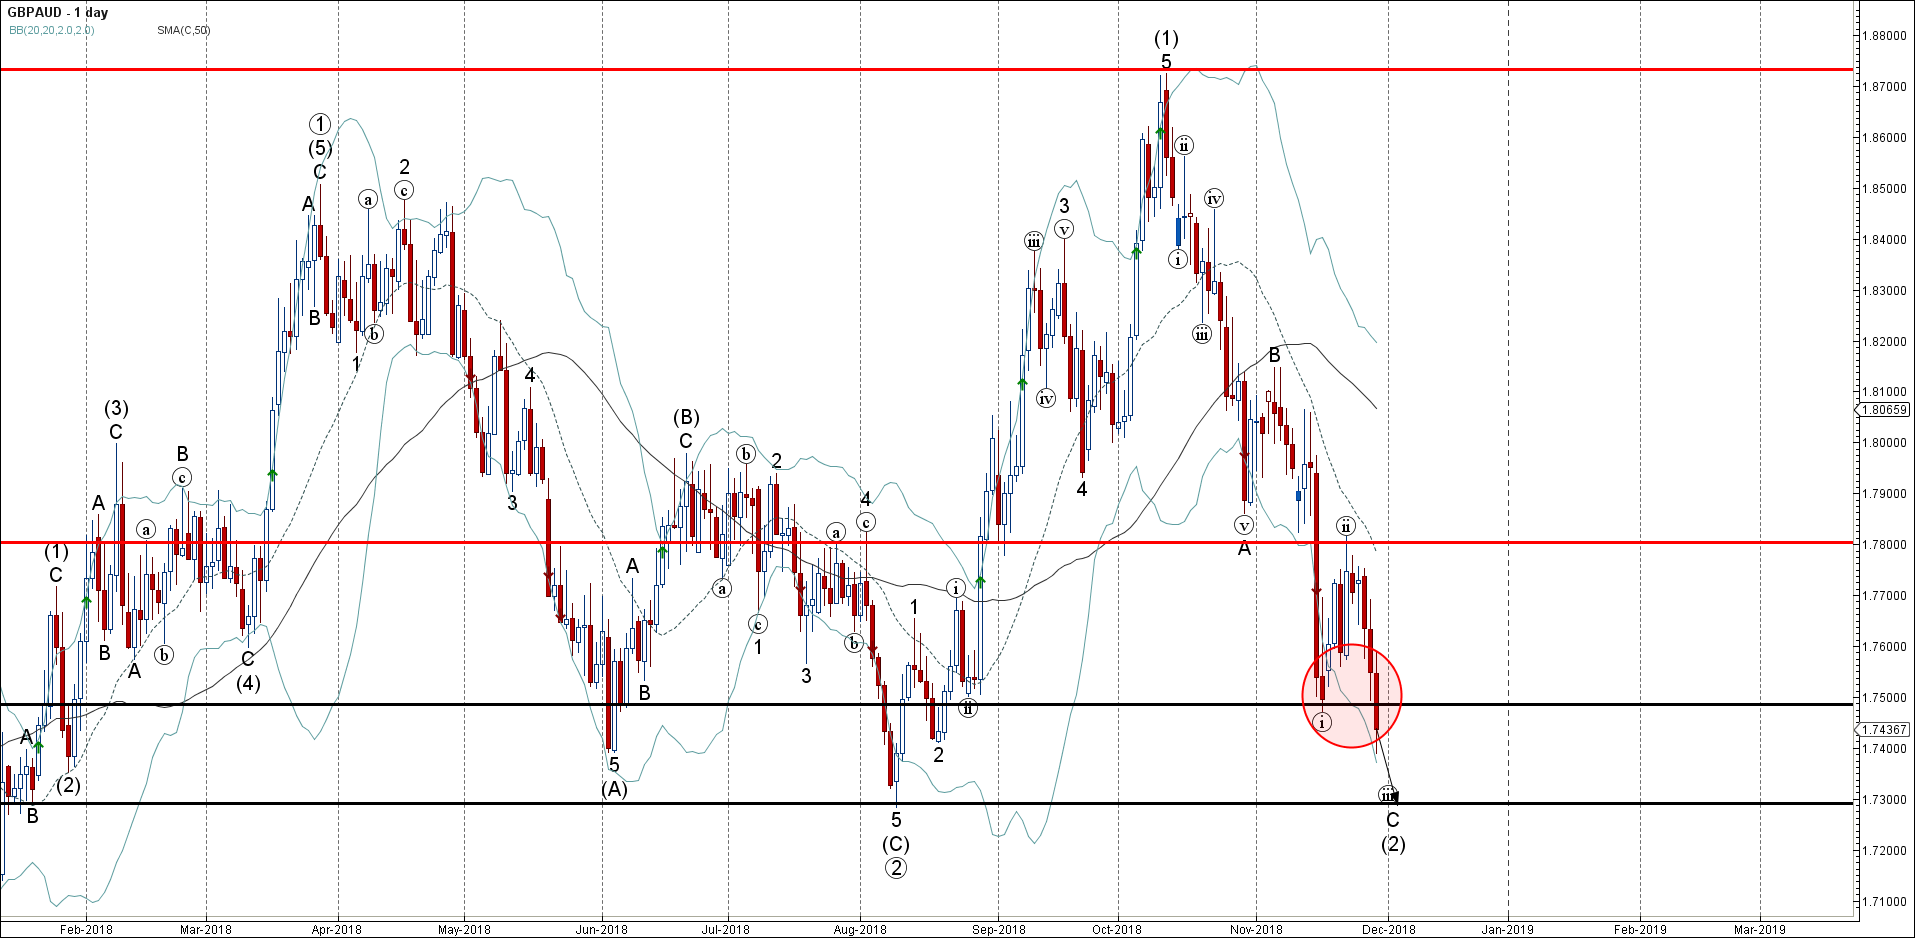
GBPAUD today broke below the key support level 1.7500 (which stopped the previous impulse wave (i) earlier this month and also at the end of August, as can be seen below).

The breakout of the support level 1.7500 continues the active short-term impulse wave C of the medium-term ABC correction (2) from the start of October.

GBPAUD is expected to fall further and re-test the next support level 1.7300 (monthly low from August and the target price for the completion of the active impulse wave C).

AddThis Website Tools
The FxPro Tech Analysis Team

The FxPro technical experts prepare a daily analysis of the most active currency pairs (majors, crosses, exotics) and commodities. Selected instruments are reviewed on daily trends (D1, H4), using the active Elliott Wave setups, Japanese candlesticks, indicators, and support/resistance levels.

Share
Published by
The FxPro Tech Analysis Team
Tags: GBPAUD

Recent Posts

NIO Wave Analysis – 31 March 2025

NIO: ⬆️ Buy - NIO reversed from support zone - Likely to rise to resistance…

7 hours ago

Nvidia Wave Analysis – 31 March 2025

Nvidia: ⬆️ Buy - Nvidia reversed from key support level 105.00 - Likely to rise…

7 hours ago

Markets rattled on consumer sentiment

Consumer sentiment index from the University of Michigan shows alarming information for stock indices, with…

14 hours ago

EURAUD Wave Analysis – 31 March 2025

EURAUD: ⬆️ Buy - EURAUD rising inside impulse wave iii - Likely to reach resistance…

14 hours ago

USDCAD Wave Analysis – 31 March 2025

USDCAD: ⬆️ Buy - USDCAD reversed from the support zone - Likely to rise to…

14 hours ago

Video Pro News Weekly: Market Shake-Up. USD Struggles & Crypto’s Next Big Move!

Major market shifts underway! The US dollar hits resistance, stocks teeter on tariff tensions, and…

19 hours ago