Categories: Technical analysis

FTSE100 Wave Analysis 8 April, 2021

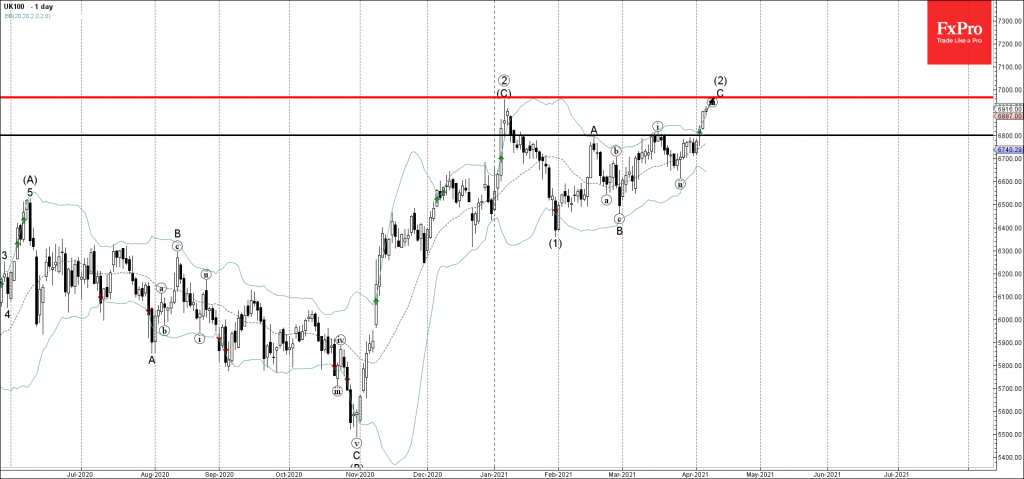
• FTSE100 broke resistance level 6800.00

• Likely to reach resistance level 6966.00

FTSE100 index continues to rise after the earlier breakout of the key resistance level 6800.00 (which stopped the previous waves A and (i)).

The breakout of the resistance level 6800.00 accelerated the active minor impulse wave C of the ABC correction (2) from January.

FTSE100 is likely to rise further in the active impulse wave C toward the next resistance level 6966.00 (multi-month high from January, top of wave (C)) – followed by 7000.00.

The FxPro Tech Analysis Team

The FxPro technical experts prepare a daily analysis of the most active currency pairs (majors, crosses, exotics) and commodities. Selected instruments are reviewed on daily trends (D1, H4), using the active Elliott Wave setups, Japanese candlesticks, indicators, and support/resistance levels.

Share
Published by
The FxPro Tech Analysis Team
Tags: FTSE100

Recent Posts

AUDJPY Wave Analysis – 5 December 2025

AUDJPY: ⬆️ Buy - AUDJPY broke long-term resistance level 102.30 - Likely to rise to…

14 minutes ago

Aptos Wave Analysis – 5 December 2025

Aptos: ⬇️ Sell - Aptos testing major support at 1.688 - Likely to fall to…

15 minutes ago

Pro News Weekly: Market Shake-Up, Dollar Drops, Gold Surges, Bitcoin Wobbles!

Welcome to Pro News Flash! 💵 The U.S. dollar slips 🏆 Major stock indices struggle…

6 hours ago

Solana Wave Analysis – 5 December 2025

Solana: ⬇️ Sell - Solana reversed from resistance zone - Likely to fall to support…

7 hours ago

EURAUD Wave Analysis – 5 December 2025

EURAUD : ⬇️ Sell - EURAUD broke the support level 1.7600 - Likely to fall…

7 hours ago

Forex has set its priorities

In 2026, experts favour the yen, see modest euro growth, and expect pressure on the…

11 hours ago

This website uses cookies