Categories: Technical analysis

FTSE 100 Wave Analysis – 8 October 2025

FTSE 100: ⬆️ Buy

– FTSE 100 broke round resistance level 9330.00

– Likely to rise to resistance level 9612.00

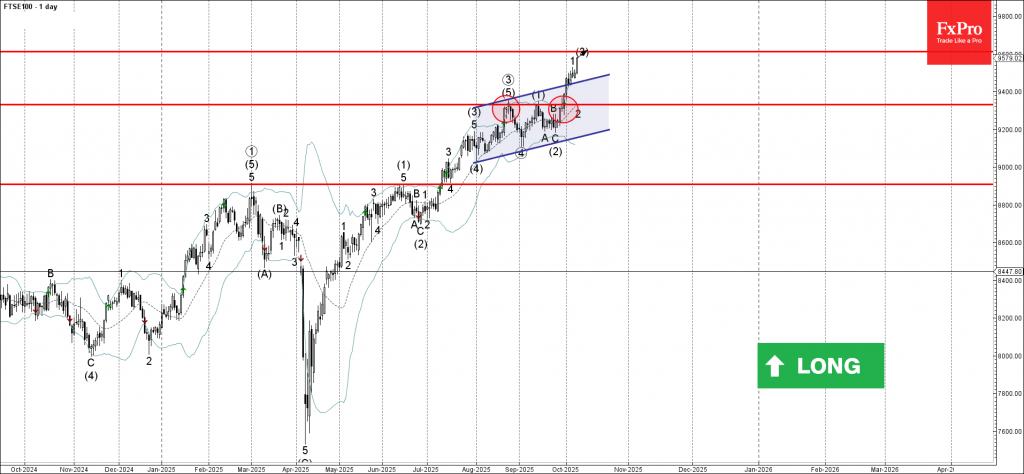
FTSE 100 index recently broke the resistance level 9330.00, which stopped the previous impulse waves (5) and (1).

The breakout of the resistance level 9330.00 accelerated the active intermediate impulse wave (3) from September – which then broke the daily up channel from July.

Given the strong daily uptrend, FTSE 100 index can be expected to rise to the next resistance level 9612.00 (target price for the completion of the active impulse wave (3).

The FxPro Tech Analysis Team

The FxPro technical experts prepare a daily analysis of the most active currency pairs (majors, crosses, exotics) and commodities. Selected instruments are reviewed on daily trends (D1, H4), using the active Elliott Wave setups, Japanese candlesticks, indicators, and support/resistance levels.

Share
Published by
The FxPro Tech Analysis Team
Tags: FTSE

Recent Posts

Pro News Flash: Gold Bulls Take Control

🥇 Gold is regaining momentum as investors lean into geopolitics, a softer US dollar and…

3 hours ago

The dollar is forced to retreat

• The reduction in geopolitical risks in Venezuela has weakened the greenback. •  Precious metal investors…

7 hours ago

Nikkei 225 Wave Analysis – 5 January 2026

Nikkei 225: ⬆️ Buy - Nikkei 225 broke resistance level 51160.00 - Likely to rise…

22 hours ago

Gold Wave Analysis – 5 January 2026

Gold: ⬆️ Buy - Gold reversed from support zone - Likely to rise to resistance…

22 hours ago

Ethereum Wave Analysis – 5 January 2026

Ethereum: ⬆️ Buy - Ethereum broke round resistance level 3000.00 - Likely to rise to…

22 hours ago

Platinum Wave Analysis – 5 January 2026

Platinum: ⬆️ Buy - Platinum reversed from support zone - Likely to rise to resistance…

22 hours ago

This website uses cookies