Categories: Technical analysis

FTSE 100 Wave Analysis 6 January, 2021

• FTSE 100 rising sharply

• Likely to rise to 6885.00 and 7000.00

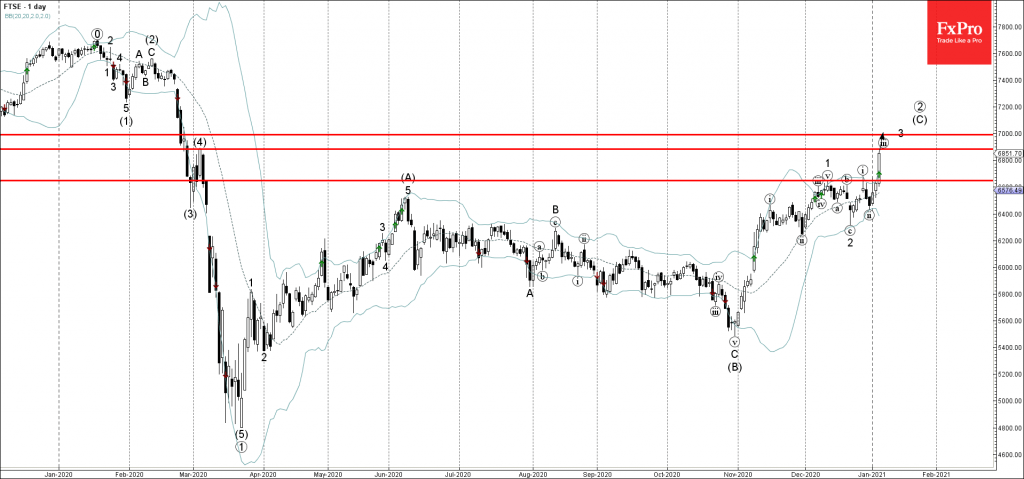
FTSE 100 index today broke sharply above the key resistance level 6645.00 (which has been reversing the price from the start of December).

The breakout of the resistance level 6645.00 added to the bullish pressure on this index – extending the active nested impulse waves (iii), 3 and (C).

FTSE 100 is expected to rise further toward the next resistance level 6885.00 (monthly high from March of 2019 ) – followed by the powerful round next resistance level 7000.00 (target for the competition of wave 3).

The FxPro Tech Analysis Team

The FxPro technical experts prepare a daily analysis of the most active currency pairs (majors, crosses, exotics) and commodities. Selected instruments are reviewed on daily trends (D1, H4), using the active Elliott Wave setups, Japanese candlesticks, indicators, and support/resistance levels.

Share
Published by
The FxPro Tech Analysis Team
Tags: FTSE100

Recent Posts

Markets pick up signals from the White House

Donald Trump has no intention of dismissing Jerome Powell. The White House's decision to postpone…

29 minutes ago

Bitcoin aims to break out of a corrective rebound

Crypto market rebounds, Bitcoin eyes $100K, Dash surges, institutional demand rises, and Ethereum staking hits…

53 minutes ago

Bitcoin Wave Analysis – 14 January 2026

Bitcoin: ⬆️ Buy - Bitcoin broke resistance area - Likely to rise to resistance level…

16 hours ago

NZDJPY Wave Analysis – 14 January 2026

NZDJPY: ⬇️ Sell - NZDJPY reversed down from the resistance area - Likely to fall…

16 hours ago

What is Leverage?

Leverage is a mechanism that lets traders control larger positions using smaller capital. By choosing…

20 hours ago

The dollar does not tolerate dissent

US GDP growth is driven not by the White House, but by AI. The Bank…

1 day ago

This website uses cookies