Categories: Technical analysis

FTSE 100 Wave Analysis 21 January 2025

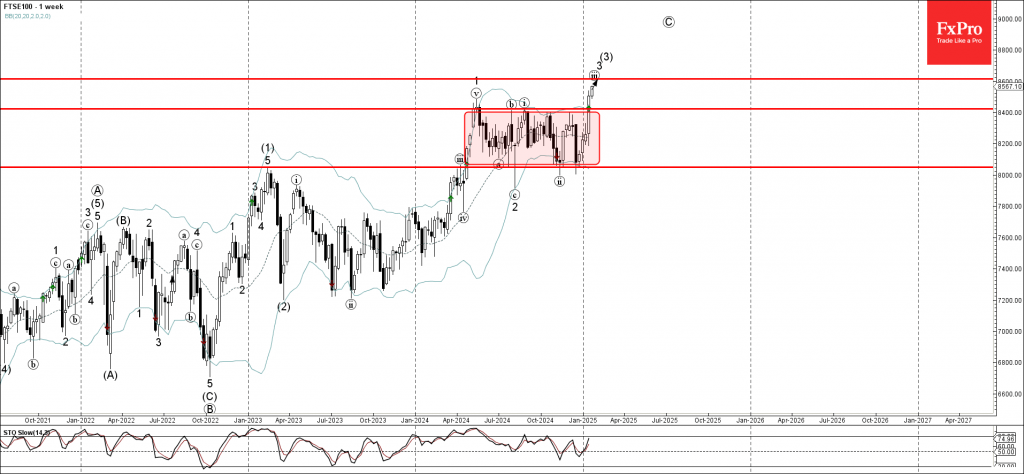
– FTSE 100 broke strong resistance level 8400.00

– Likely to rise to resistance level 8600.00

FTSE 100 index rising sharply after the price broke the strong resistance level 8400.00, which is the upper border of the sideways price range inside which the index has been moving from the start of 2024.

The breakout of this price range inside accelerated the active impulse waves iii and 3, which belong to the weekly upward impulse sequence (3) from the start of 2023.

Given the overriding uptrend seen on weekly charts, FTSE 100 index can be expected to rise to the next resistance level 8600.00, the target price for the completion of the active impulse wave iii.

The FxPro Tech Analysis Team

The FxPro technical experts prepare a daily analysis of the most active currency pairs (majors, crosses, exotics) and commodities. Selected instruments are reviewed on daily trends (D1, H4), using the active Elliott Wave setups, Japanese candlesticks, indicators, and support/resistance levels.

Share
Published by
The FxPro Tech Analysis Team
Tags: FTSE 100

Recent Posts

CHFJPY Wave Analysis – 9 January 2026

CHFJPY: ⬆️ Buy - CHFJPY reversed from support area - Likely to rise to resistance…

2 days ago

Exxon Mobil Wave Analysis – 9 January 2026

Exxon Mobil: ⬆️ Buy - Exxon Mobil reversed from support area - Likely to rise…

2 days ago

Pro News Weekly: Dollar Rebounds as Markets Test New Limits

Welcome to Pro News Weekly! Here’s what is shaping the markets: 💵 The U.S. dollar…

2 days ago

Geopolitics will destroy the euro

•    EURUSD falls due to geopolitics and expectations of tariff removal •    Gold returns to…

2 days ago

Platinum Wave Analysis – 8 January 2026

Platinum: ⬇️ Sell - Platinum reversed from pivotal resistance level 150.00 - Likely to fall to…

3 days ago

Baidu Wave Analysis – 8 January 2026

Baidu: ⬇️ Sell - Baidu reversed from resistance zone - Likely to fall to support level…

3 days ago

This website uses cookies