Categories: Technical analysis

FTSE 100 Wave Analysis – 16 September 2025

FTSE 100: ⬇️ Sell

– FTSE 100 reversed from resistance zone

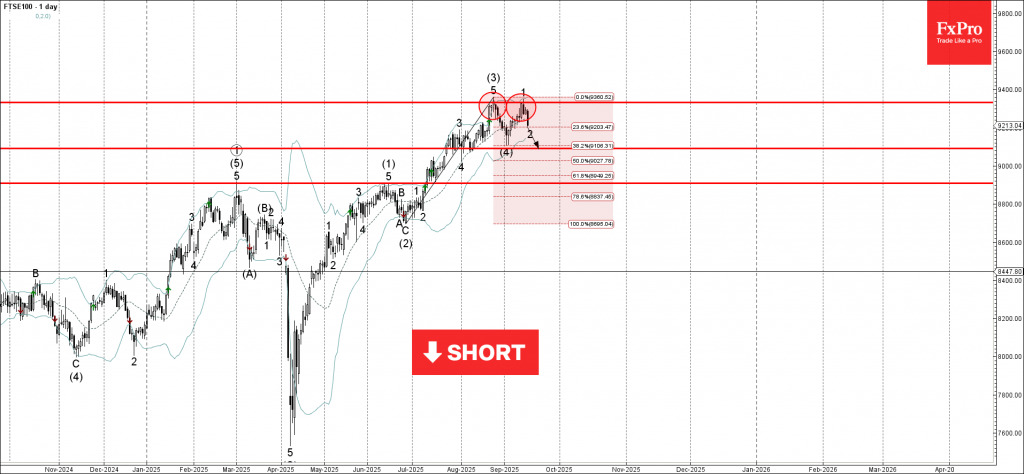
– Likely to fall to support level 9090.00

FTSE 100 index recently reversed down from the resistance zone between the key resistance level 9330,00 (which stopped the previous wave (3) in the middle of August, as can be seen below) and the upper daily Bollinger Band.

The downward reversal from this resistance zone started the active short-term correction 2.

FTSE 100 index can be expected to fall to the next support level 9090.00, the target for the completion of the wave 2 (low of the previous correction (4)).

The FxPro Tech Analysis Team

The FxPro technical experts prepare a daily analysis of the most active currency pairs (majors, crosses, exotics) and commodities. Selected instruments are reviewed on daily trends (D1, H4), using the active Elliott Wave setups, Japanese candlesticks, indicators, and support/resistance levels.

Share
Published by
The FxPro Tech Analysis Team
Tags: FTSE 100

Recent Posts

Markets pick up signals from the White House

Donald Trump has no intention of dismissing Jerome Powell. The White House's decision to postpone…

3 hours ago

Nat Gas Current situation #tradelikeapro #tradingshort #tradingtips #gas #tradingstrategy #trading

Today is Thursday, January 15th. Once again we will talk about the gas market. The…

3 hours ago

Bitcoin aims to break out of a corrective rebound

Crypto market rebounds, Bitcoin eyes $100K, Dash surges, institutional demand rises, and Ethereum staking hits…

3 hours ago

Bitcoin Wave Analysis – 14 January 2026

Bitcoin: ⬆️ Buy - Bitcoin broke resistance area - Likely to rise to resistance level…

18 hours ago

NZDJPY Wave Analysis – 14 January 2026

NZDJPY: ⬇️ Sell - NZDJPY reversed down from the resistance area - Likely to fall…

18 hours ago

What is Leverage?

Leverage is a mechanism that lets traders control larger positions using smaller capital. By choosing…

23 hours ago

This website uses cookies