Categories: Technical analysis

FTSE 100 Wave Analysis 15 February, 2021

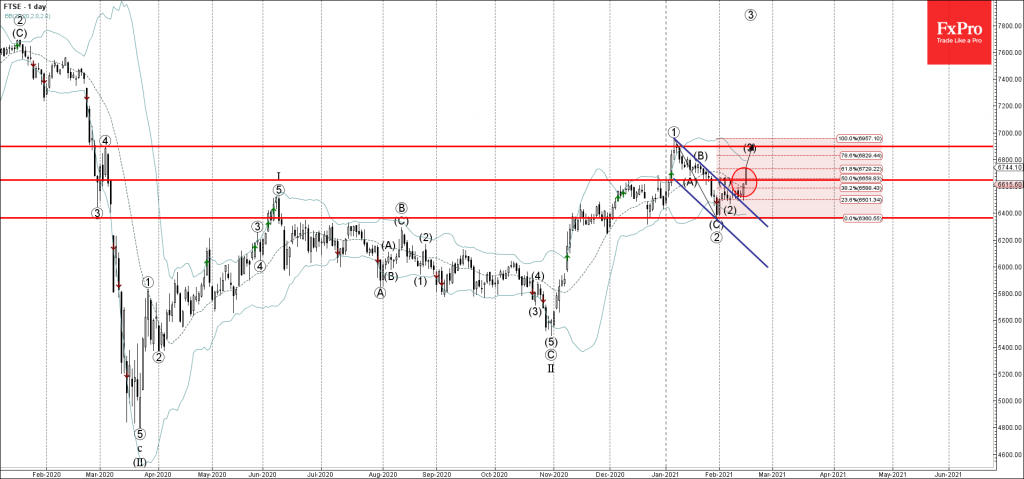
• FTSE 100 broke resistance level 6645.00

• Likely to test resistance level 6900.00

FTSE 100 index continues to advance after the price broke the resistance level 6645.00 intersecting with the 50% Fibonacci correction of the previous ABC retracement from the start of January.

The breakout of the resistance level 6645.00 was preceded by the breakout of the short-term down channel from last month.

FTSE 100 is likely to rise further toward the next resistance level 6900.00 (target price for the completion of the active impulse wave (3)).

AddThis Website Tools
The FxPro Tech Analysis Team

The FxPro technical experts prepare a daily analysis of the most active currency pairs (majors, crosses, exotics) and commodities. Selected instruments are reviewed on daily trends (D1, H4), using the active Elliott Wave setups, Japanese candlesticks, indicators, and support/resistance levels.

Share
Published by
The FxPro Tech Analysis Team
Tags: FTSE 100

Recent Posts

AMD Wave Analysis – 28 March 2025

AMD: ⬇️ Sell - AMD reversed from pivotal resistance level 115.00 - Likely to fall…

2 days ago

Google Wave Analysis – 28 March 2025

Google: ⬇️ Sell - Google broke key support level 160.00 - Likely to fall to…

2 days ago

Gold Wave Analysis – 28 March 2025

Gold: ⬆️ Buy - Gold broke resistance level 3050.00 - Likely to rise to resistance…

2 days ago

Ethereum Wave Analysis – 28 March 2025

Ethereum: ⬇️ Sell - Ethereum reversed from the resistance level 2120.00 - Likely to fall…

2 days ago

US inflation accelerates but lags income growth

US PCE inflation exceeded expectations at 2.8% in February. Income growth and savings rates remain…

2 days ago

What is next: Australia Rate, EU CPI, US NFP

Europe will switch to daylight saving time next week. Key events include the RBA's rate…

2 days ago