Categories: Technical analysis

FTSE 100 Wave Analysis 15 December 2023

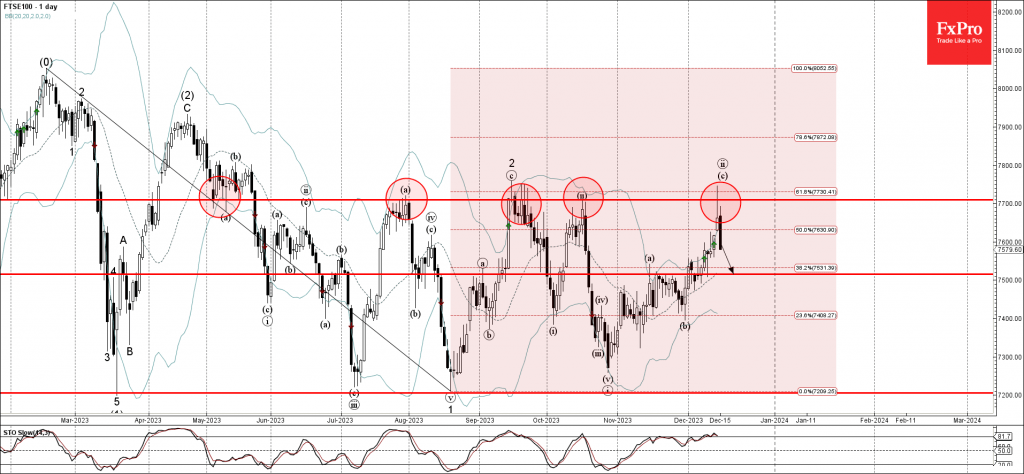
– FTSE 100 reversed from resistance level 7700.00

– Likely to fall to support level 7500.00

FTSE 100 index under the bearish pressure after the index reversed down from the resistance level 7700.00 (which has been reversing the index from June) standing above the upper daily Bollinger Band.

The resistance level 7700.00 was strengthened by the coinciding 61.8% Fibonacci correction of the downward impulse from April.

Given strength of the resistance level 7700.00 and the overbought daily Stochastic, FTSE 100 can be expected to fall further to the next support level 7500.00.

The FxPro Tech Analysis Team

The FxPro technical experts prepare a daily analysis of the most active currency pairs (majors, crosses, exotics) and commodities. Selected instruments are reviewed on daily trends (D1, H4), using the active Elliott Wave setups, Japanese candlesticks, indicators, and support/resistance levels.

Share
Published by
The FxPro Tech Analysis Team
Tags: FTSE 100

Recent Posts

EURCAD Wave Analysis 6 September 2024

- EURCAD reversed from pivotal support level 1.4900 - Likely to rise to resistance level…

1 day ago

EURUSD Wave Analysis 6 September 2024

- EURUSD reversed from support level 1.1030 - Likely to rise to resistance level 1.1200…

1 day ago

Further Unwinding of Carry Trade

The unwinding of the carry trade in the FX market continues, with the major safe…

1 day ago

Bitcoin pressured by risk-off mood

Market Picture The pressure on risk assets continues, pushing the crypto market capitalisation back below…

2 days ago

AUDUSD Wave Analysis 5 September 2024

- AUDUSD reversed from support level 0.6700 - Likely to rise to resistance level 0.6800…

2 days ago

Gold Wave Analysis 5 September 2024

- Gold reversed from support level 2475.00 - Likely to rise to resistance level 2535.00…

2 days ago

This website uses cookies