Categories: Technical analysis

FTSE 100 Wave Analysis 13 February 2024

– FTSE 100 index falling strongly

– Likely to fall to support level 7440.00

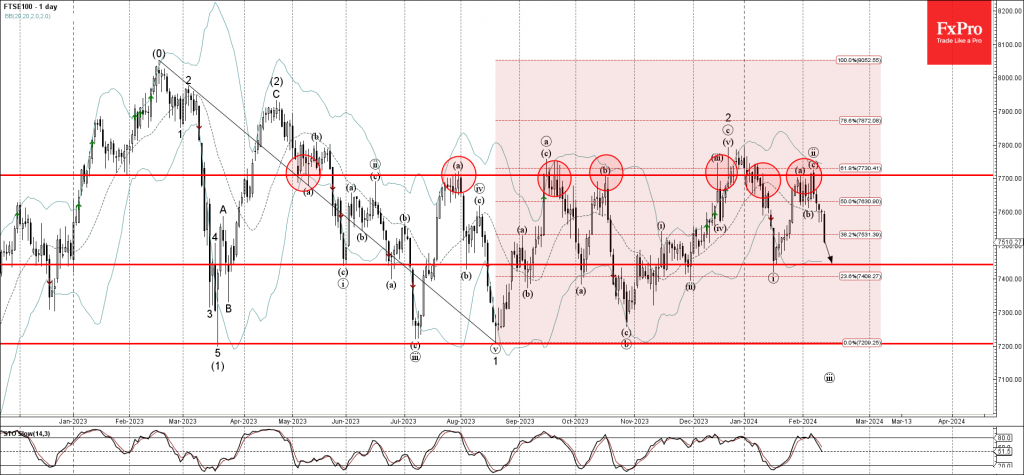
FTSE 100 index falling strongly after the price failed to break above the major resistance level 7700.00 (which has been repeatedly reversing the index from June of last year).

The resistance level 7700.00 was strengthened by the upper daily Bollinger Band and by the 61.8% Fibonacci correction of the previous downward impulse from February.

FTSE 100 index can be expected to fall further to the next support level 7440.00 (which stopped the two of the pervious waves ii and i).

The FxPro Tech Analysis Team

The FxPro technical experts prepare a daily analysis of the most active currency pairs (majors, crosses, exotics) and commodities. Selected instruments are reviewed on daily trends (D1, H4), using the active Elliott Wave setups, Japanese candlesticks, indicators, and support/resistance levels.

Share
Published by
The FxPro Tech Analysis Team
Tags: FTSE

Recent Posts

Solana Wave Analysis – 5 December 2025

Solana: ⬇️ Sell - Solana reversed from resistance zone - Likely to fall to support…

2 hours ago

EURAUD Wave Analysis – 5 December 2025

EURAUD : ⬇️ Sell - EURAUD broke the support level 1.7600 - Likely to fall…

2 hours ago

Forex has set its priorities

In 2026, experts favour the yen, see modest euro growth, and expect pressure on the…

6 hours ago

Bear market rebound in crypto is likely to continue

Crypto rebounds continue; Bitcoin faces resistance, with a mixed market outlook ahead, as regulatory changes…

7 hours ago

Coca-Cola Wave Analysis – 4 December 2025

Coca-Cola: ⬇️ Sell - Coca-Cola reversed from long-term resistance level 73.25 - Likely to fall to…

20 hours ago

DraftKings Wave Analysis – 4 December 2025

DraftKings: ⬆️ Buy - DraftKings reversed from support zone - Likely to rise to resistance level…

20 hours ago

This website uses cookies