Categories: Technical analysis

FTSE 100 Wave Analysis 12 September 2023

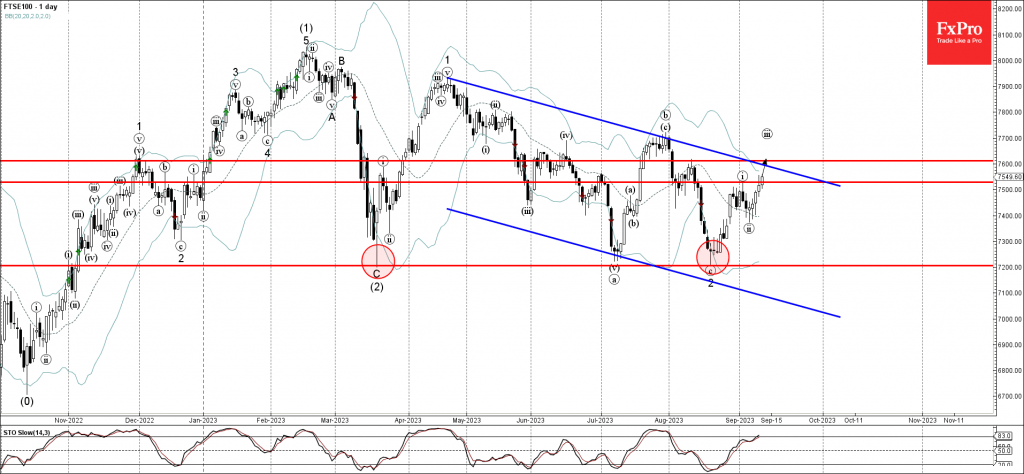
– FTSE 100 reversed from resistance level 7528.00

– Likely to rise to resistance level 7600.00

FTSE 100 index recently broke the resistance level 7528.00 (top of the pervious impulse wave i), intersecting with the resistance trendline of the daily down channel from April.

The breakout of the resistance level 7528.00 accelerated the active short-term impulse wave iii.

FTSE 100 index can be expected to rise further toward the next resistance level 7600.00 (which coincides with the daily down channel from April).

The FxPro Tech Analysis Team

The FxPro technical experts prepare a daily analysis of the most active currency pairs (majors, crosses, exotics) and commodities. Selected instruments are reviewed on daily trends (D1, H4), using the active Elliott Wave setups, Japanese candlesticks, indicators, and support/resistance levels.

Share
Published by
The FxPro Tech Analysis Team
Tags: FTSE100

Recent Posts

EURCAD Wave Analysis 6 September 2024

- EURCAD reversed from pivotal support level 1.4900 - Likely to rise to resistance level…

2 days ago

EURUSD Wave Analysis 6 September 2024

- EURUSD reversed from support level 1.1030 - Likely to rise to resistance level 1.1200…

2 days ago

Further Unwinding of Carry Trade

The unwinding of the carry trade in the FX market continues, with the major safe…

2 days ago

Bitcoin pressured by risk-off mood

Market Picture The pressure on risk assets continues, pushing the crypto market capitalisation back below…

2 days ago

AUDUSD Wave Analysis 5 September 2024

- AUDUSD reversed from support level 0.6700 - Likely to rise to resistance level 0.6800…

2 days ago

Gold Wave Analysis 5 September 2024

- Gold reversed from support level 2475.00 - Likely to rise to resistance level 2535.00…

2 days ago

This website uses cookies