Categories: Technical analysis

FTSE 100 Wave Analysis – 1 November, 2021

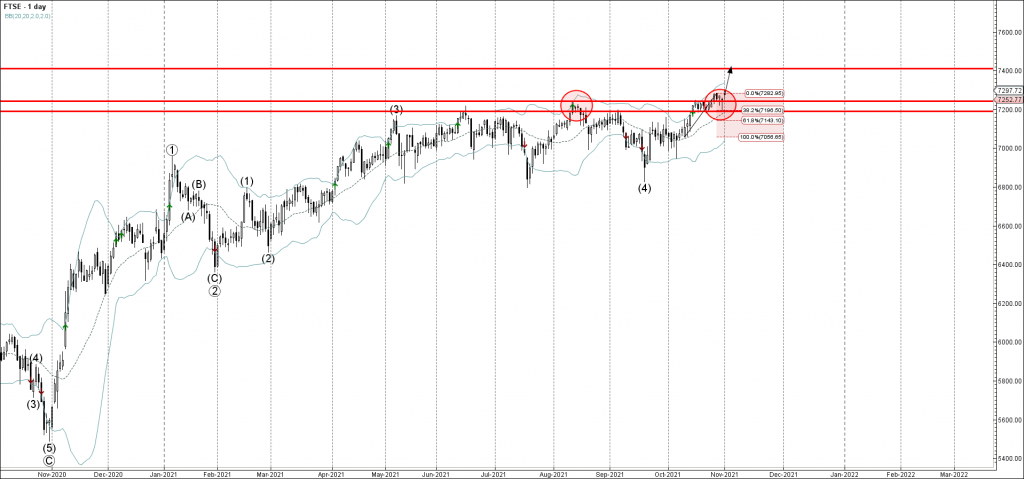
• FTSE 100 broke key resistance level 7285.00

• Likely to rise to resistance level 7400.00                                                                 


FTSE 100 index continues to rise after the price broke the key resistance level 7285.00 (previous monthly high from October).

The breakout of the resistance level 7285.00 accelerated the active intermediate impulse wave (5).

Given the clear multi-month uptrend, FTSE 100 index can be expected to rise further toward the next resistance level 7400.00.

The FxPro Tech Analysis Team

The FxPro technical experts prepare a daily analysis of the most active currency pairs (majors, crosses, exotics) and commodities. Selected instruments are reviewed on daily trends (D1, H4), using the active Elliott Wave setups, Japanese candlesticks, indicators, and support/resistance levels.

Share
Published by
The FxPro Tech Analysis Team
Tags: FTSE 100

Recent Posts

Persisting pressure on crypto 

Market picture  The crypto market has lost 2% of its capitalisation over the last 24…

3 hours ago

S&P 500 Wave Analysis 7 May 2024

- S&P 500 reversed from support level 5000.00 - Likely to rise to resistance level…

16 hours ago

USDCHF Wave Analysis 7 May 2024

- USDCHF reversed from support zone - Likely to rise to resistance level 0.9200 USDCHF…

16 hours ago

EURUSD at the equilibrium, where will it go next?

The single currency is trading near $1.076, waiting for further cues and facing serious resistance…

21 hours ago

Bitcoin can’t accelerate but won’t give up trying

Market picture  The crypto market capitalisation fell by 1.7% in 24 hours to $2.29 trillion,…

1 day ago

USDJPY Wave Analysis 6 May 2024

- USDJPY reversed from support zone - Likely to rise to resistance level 155.65 USDJPY…

2 days ago

This website uses cookies