Categories: Technical analysis

FTSE 100 Index Wave Analysis 15 March, 2021

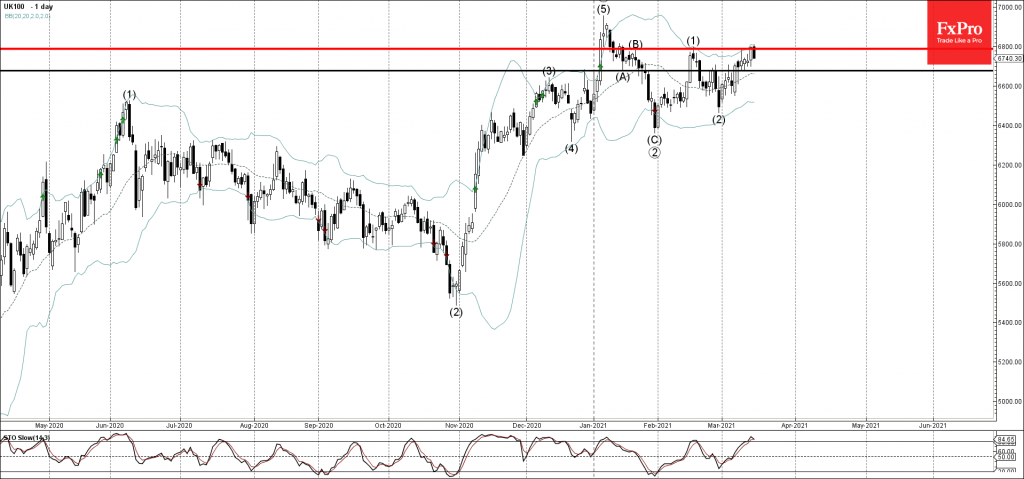
• FTSE 100 Index reversed from resistance level 6800.00

• Likely to fall to support level 6675.00

FTSE 100 Index today reversed down from the resistance level 6800.00 (which has been reversing the price from January) – standing near the upper daily Bollinger Band.

The downward reversal from the resistance level 6800.00 stopped the previous intermediate impulse wave (3) from last month.

With the overbought reading on the daily Stochastic – FTSE 100 Index is likely to fall further toward the next support level 6675.00 (former resistance from the end of February).

The FxPro Tech Analysis Team

The FxPro technical experts prepare a daily analysis of the most active currency pairs (majors, crosses, exotics) and commodities. Selected instruments are reviewed on daily trends (D1, H4), using the active Elliott Wave setups, Japanese candlesticks, indicators, and support/resistance levels.

Share
Published by
The FxPro Tech Analysis Team
Tags: FTSE100

Recent Posts

Bitcoin Cash Wave Analysis – 12 January 2026

Bitcoin Cash: ⬇️ Sell - Bitcoin Cash reversed from resistance area - Likely to fall…

16 minutes ago

EURJPY Wave Analysis – 12 January 2026

EURJPY: ⬆️ Buy - EURJPY reversed from support area - Likely to rise to resistance…

18 minutes ago

Gold shines on an anti-fiat thesis

The dollar suffered due to threats to the Fed’s independence. Gold managed to renew its…

10 hours ago

SP500 Current situation #trading #tradelikeapro #sp500 #tradingshorts #tradingstrategy

Today is Monday, the 12th of January, and once again we will talk about the…

11 hours ago

Crypto: sell-the-growth continues

Crypto markets remain volatile; Bitcoin faces selling pressure, XRP slips, Monero surges, and market signals…

12 hours ago

CHFJPY Wave Analysis – 9 January 2026

CHFJPY: ⬆️ Buy - CHFJPY reversed from support area - Likely to rise to resistance…

3 days ago

This website uses cookies