Financial data analysis graph showing stock market trends on a trading board. Horizontal composition with copy space and selective focus.
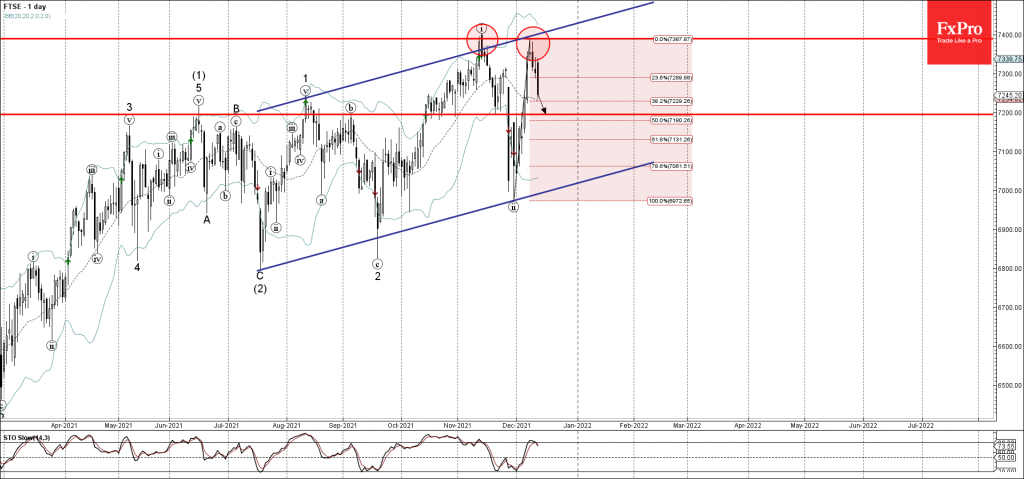
• FTSE 100 index reversed from resistance level 7390.00
• Likely to fall to support level 7200.00
FTSE 100 index recently reversed down from the major resistance level 7390.00 (former monthly high from November) – intersecting with the upper resistance trendline of the wide up channel from July.
The downward reversal from the resistance level 7390.00 started the active downward correction.
FTSE 100 index can be expected to fall further toward the key support level 7200.00 (former strong support from October and November).
Brent Crude oil ⬆️ Buy - Brent Crude oil rising inside impulse wave c -…
USDJPY ⬆️ Buy - USDJPY broke resistance area - Likely to rise to resistance level…
Exxon Mobil ⬆️ Buy - Exxon Mobil broke resistance level 125.60 - Likely to rise…
Brent Crude oil ⬆️ Buy - BNB broke out of sideways price range - Likely…
US CPI data a bit softer than forecasts, sparking brief market optimism, but resistance remains.…
🛢️ Oil prices are finding fresh strength as geopolitical tensions in the Middle East reignite…
This website uses cookies