Categories: Technical analysis

FTSE 100 index Wave Analysis – 11 November 2025

FTSE 100 index: ⬆️ Buy

– FTSE 100 index broke resistance area

– Likely to rise to resistance level 10000.00

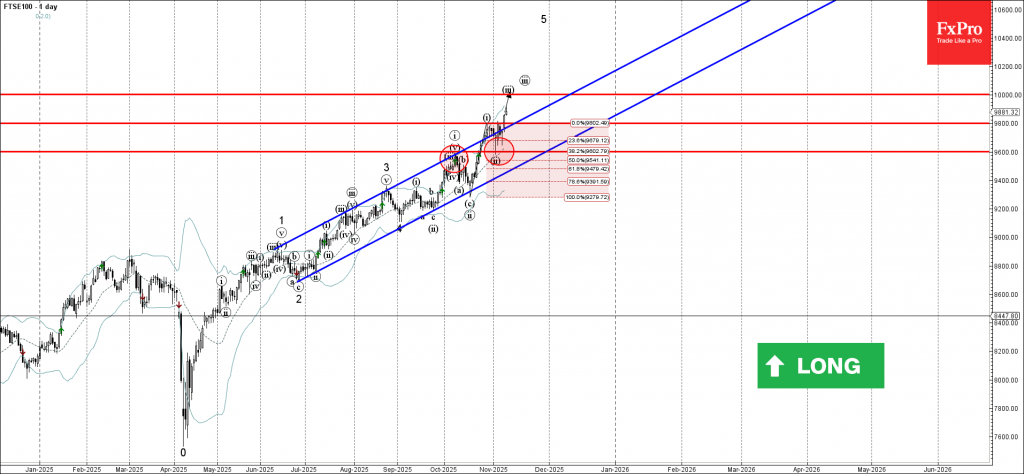
FTSE 100 index recently broke the resistance area between the resistance level 9800.00 and the resistance trendline of the daily up channel from June.

The breakout of this resistance area accelerated the active short-term impulse wave iii of the sharp upward impulse wave 5 from the start of September.

Given the clear daily uptrend, FTSE 100 index can be expected to rise to the next round resistance level 10000.00 (target price for the completion of the active impulse wave iii).

The FxPro Tech Analysis Team

The FxPro technical experts prepare a daily analysis of the most active currency pairs (majors, crosses, exotics) and commodities. Selected instruments are reviewed on daily trends (D1, H4), using the active Elliott Wave setups, Japanese candlesticks, indicators, and support/resistance levels.

Share
Published by
The FxPro Tech Analysis Team
Tags: FTSE 100

Recent Posts

AUDUSD Wave Analysis – 24 December 2025

AUDUSD: ⬆️ Buy - AUDUSD broke key resistance level 0.6690 - Likely to rise to…

2 days ago

Tron Wave Analysis – 24 December 2025

Tron: ⬇️ Sell - Tron reversed from resistance zone - Likely to fall to support…

2 days ago

Stellar Wave Analysis – 24 December 2025

Stellar: ⬇️ Sell - Stellar reversed from pivotal resistance level 0.2200 - Likely to fall…

2 days ago

USDCHF Wave Analysis – 24 December 2025

USDCHF: ⬇️ Sell - USDCHF broke support level 0.7885 - Likely to fall to support…

2 days ago

Precious metals rewarded for success

The US dollar is falling as a safe-haven asset amid growing risk appetite. Gold is…

2 days ago

Crypto market: the punchline is coming soon

Market Overview The crypto market cap declined 1.7% over the past day and 15% or…

2 days ago

This website uses cookies