Categories: Technical analysis

FTSE 100 index Wave Analysis 11 January 2024

– FTSE 100 index reversed from resistance level 7700.00

– Likely to fall to support level 7550.00

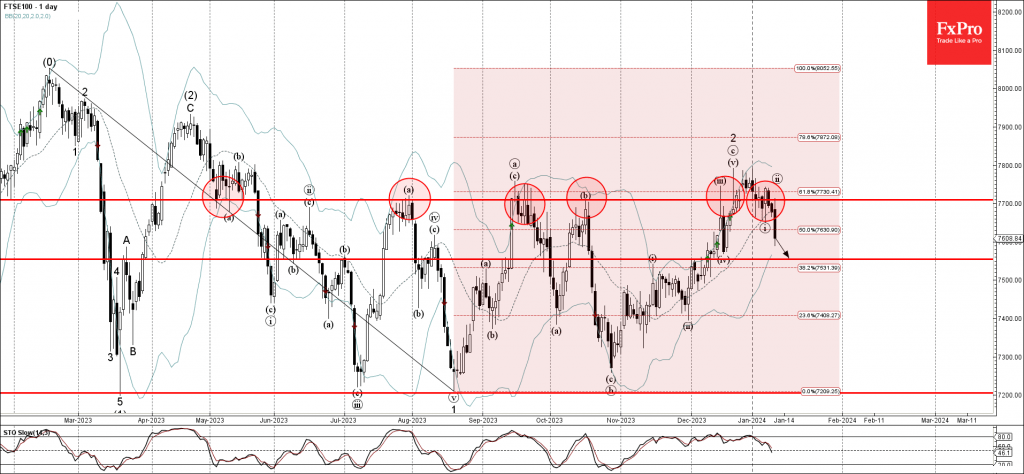
FTSE 100 index recently reversed down from the multi-month resistance level 7700.00 (which has been reversing the pair from the end of July).

The resistance level 7700.00 was strengthened by the upper daily Bollinger Band and by the 61.8% Fibonacci correction of the downward impulse from April.

FTSE 100 index can be expected to fall further to the next support level 7550.00 (former resistance from November).

The FxPro Tech Analysis Team

The FxPro technical experts prepare a daily analysis of the most active currency pairs (majors, crosses, exotics) and commodities. Selected instruments are reviewed on daily trends (D1, H4), using the active Elliott Wave setups, Japanese candlesticks, indicators, and support/resistance levels.

Share
Published by
The FxPro Tech Analysis Team
Tags: FTSE

Recent Posts

GBPCHF Wave Analysis 25 June 2024

- GBPCHF reversed from support level 1.1220 - Likely to rise to resistance level 1.1450…

12 hours ago

USDCAD Wave Analysis 25 June 2024

- USDCAD reversed from key support level 1.3620 - Likely to rise to resistance level…

12 hours ago

Nasdaq100 and Nvidia: shakeout, but no reversal yet

Shares of Nvidia, the world's most traded, most popular, and most valuable company, have been…

20 hours ago

Bitcoin’s Attractive Drop

Market Picture The cryptocurrency market was falling to a total capitalisation of $2.2 trillion at…

23 hours ago

Amazon Wave Analysis 24 June 2024

- Amazon reversed from key resistance level 188.50 - Likely to fall to support level…

1 day ago

EURJPY Wave Analysis 24 June 2024

- EURJPY approaching strong resistance level 171.55 - Likely to correct down from 171.55 EURJPY…

1 day ago

This website uses cookies