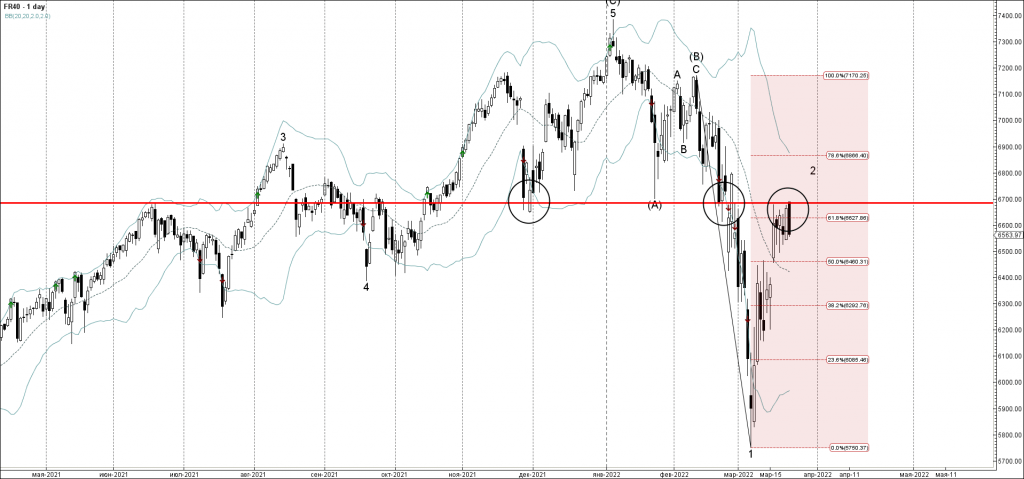
• FR40 reversed from resistance level 6700.00
• Likely to fall to support level 6500.00
FR40 index recently reversed down from the resistance level 6700.00 (former support which has been reversing the price from February).
The resistance level 6700.00 was further strengthened by the 61.8% Fibonacci correction of the downward impulse 1 from February.
FR40 index can be expected to fall further toward the next support level 6500.00.