Categories: Technical analysis

Ford Wave Analysis 31 January 2024

– Ford reversed from support level 11.00

– Likely to rise to resistance level 12.40

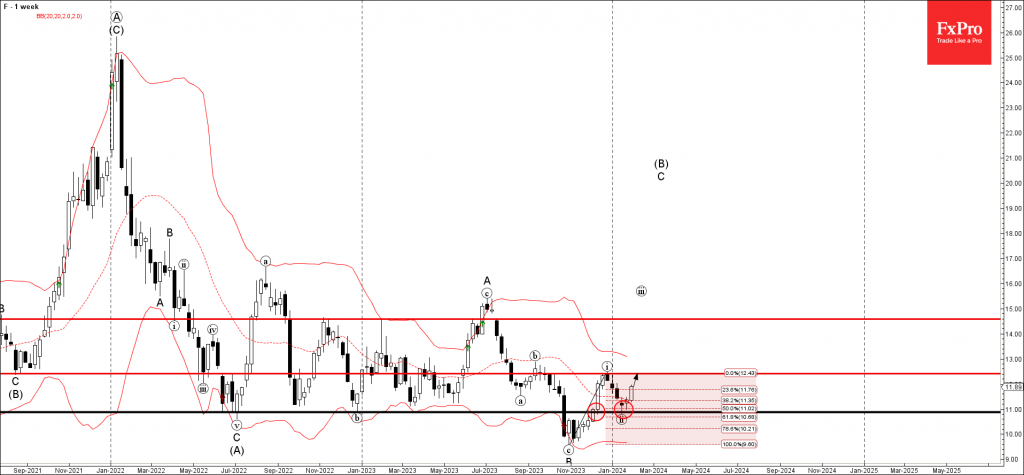
Ford recently reversed up from the key support level 11.00, which has been repeatedly reversing the price from the middle of 2022, as can be seen from the weekly Ford chart below.

The support level 11.00 was strengthened by the 20-week moving average and by the 50% Fibonacci correction of the upward impulse from last year.

Given the strength of the support level 11.00, Ford can be expected to rise further to the next resistance level 12.40 (top of the previous impulse wave i).

The FxPro Tech Analysis Team

The FxPro technical experts prepare a daily analysis of the most active currency pairs (majors, crosses, exotics) and commodities. Selected instruments are reviewed on daily trends (D1, H4), using the active Elliott Wave setups, Japanese candlesticks, indicators, and support/resistance levels.

Share
Published by
The FxPro Tech Analysis Team
Tags: Ford

Recent Posts

EURCAD Wave Analysis 6 September 2024

- EURCAD reversed from pivotal support level 1.4900 - Likely to rise to resistance level…

2 days ago

EURUSD Wave Analysis 6 September 2024

- EURUSD reversed from support level 1.1030 - Likely to rise to resistance level 1.1200…

2 days ago

Further Unwinding of Carry Trade

The unwinding of the carry trade in the FX market continues, with the major safe…

2 days ago

Bitcoin pressured by risk-off mood

Market Picture The pressure on risk assets continues, pushing the crypto market capitalisation back below…

2 days ago

AUDUSD Wave Analysis 5 September 2024

- AUDUSD reversed from support level 0.6700 - Likely to rise to resistance level 0.6800…

2 days ago

Gold Wave Analysis 5 September 2024

- Gold reversed from support level 2475.00 - Likely to rise to resistance level 2535.00…

2 days ago

This website uses cookies