Categories: Technical analysis

Ford Wave Analysis – 24 February, 2020

  • Ford broke support level 8.00
  • Likely to fall to 7.6

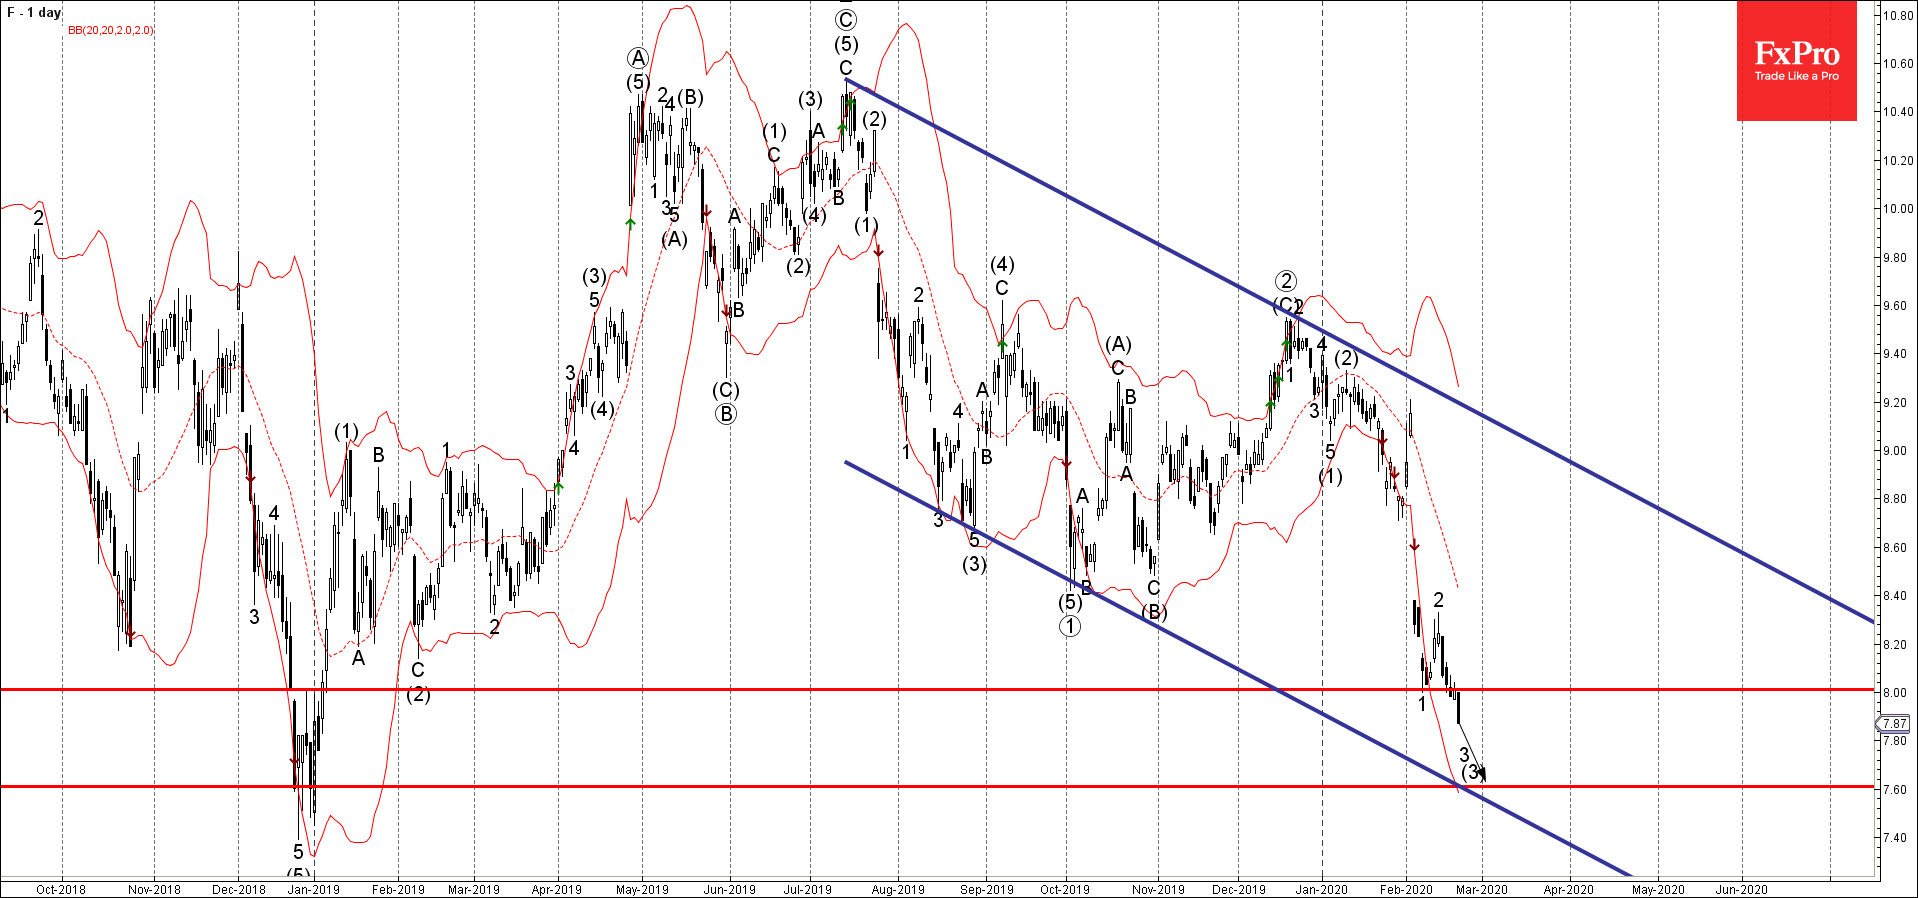
Ford recently broke below the support level 8.00 (which stopped the previous sharp downward impulse wave 1 at the start of February, as can be seen below).

The breakout of the support level 8.00 accelerated the active impulse wave 3 and (3) – both of which belong to the powerful downward impulse wave ③ from December.

Given the clear daily downtrend and the strength of the active impulse wave 3 and (3) – Ford is likely to fall further toward the next support level 7.6 (forecast price for the completion of the active impulse wave (3)).

The FxPro Tech Analysis Team

The FxPro technical experts prepare a daily analysis of the most active currency pairs (majors, crosses, exotics) and commodities. Selected instruments are reviewed on daily trends (D1, H4), using the active Elliott Wave setups, Japanese candlesticks, indicators, and support/resistance levels.

Share
Published by
The FxPro Tech Analysis Team
Tags: F

Recent Posts

Brent Crude oil Wave Analysis – 13 January 2026

Brent Crude oil ⬆️ Buy - Brent Crude oil rising inside impulse wave c -…

2 hours ago

USDJPY Wave Analysis – 13 January 2026

USDJPY ⬆️ Buy - USDJPY broke resistance area - Likely to rise to resistance level…

2 hours ago

Exxon Mobil Wave Analysis – 13 January 2026

Exxon Mobil ⬆️ Buy - Exxon Mobil broke resistance level 125.60 - Likely to rise…

2 hours ago

BNB Wave Analysis – 13 January 2026

Brent Crude oil ⬆️ Buy - BNB broke out of sideways price range - Likely…

2 hours ago

A slightly weaker CPI was not enough to break through the highs

US CPI data a bit softer than forecasts, sparking brief market optimism, but resistance remains.…

8 hours ago

Pro News Flash: Global Tensions Fuel a Fresh Oil Rally

🛢️ Oil prices are finding fresh strength as geopolitical tensions in the Middle East reignite…

8 hours ago

This website uses cookies