Categories: Technical analysis

Ford Wave Analysis 22 August 2024

– Ford reversed from round support level 10.00

– Likely to rise to resistance level 11.50

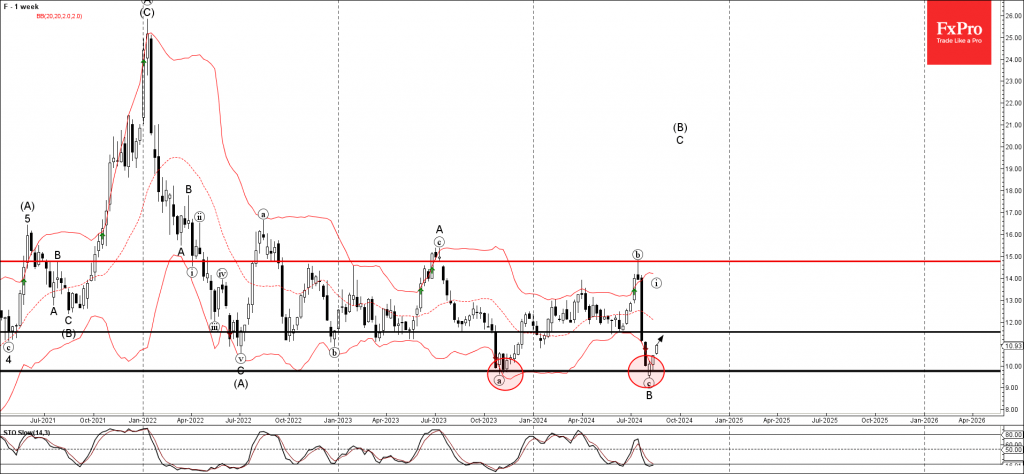
Ford recently reversed up from the strong round support level 10.00 (which previously stopped the multi-year downtrend at the end of 2023) coinciding with the lower weekly Bollinger Band.

The upward reversal from the support level 10.00 stopped the B-wave of the active ABC correction (B) from the middle of 2022.

Given the strength of the support level 10.00 the still oversold weekly Stochastic, Ford can be expected to rise further to the next resistance level 11.50 (former support from May).

The FxPro Tech Analysis Team

The FxPro technical experts prepare a daily analysis of the most active currency pairs (majors, crosses, exotics) and commodities. Selected instruments are reviewed on daily trends (D1, H4), using the active Elliott Wave setups, Japanese candlesticks, indicators, and support/resistance levels.

Share
Published by
The FxPro Tech Analysis Team
Tags: Ford

Recent Posts

CHFJPY Wave Analysis – 9 January 2026

CHFJPY: ⬆️ Buy - CHFJPY reversed from support area - Likely to rise to resistance…

2 days ago

Exxon Mobil Wave Analysis – 9 January 2026

Exxon Mobil: ⬆️ Buy - Exxon Mobil reversed from support area - Likely to rise…

2 days ago

Pro News Weekly: Dollar Rebounds as Markets Test New Limits

Welcome to Pro News Weekly! Here’s what is shaping the markets: 💵 The U.S. dollar…

3 days ago

Geopolitics will destroy the euro

•    EURUSD falls due to geopolitics and expectations of tariff removal •    Gold returns to…

3 days ago

Platinum Wave Analysis – 8 January 2026

Platinum: ⬇️ Sell - Platinum reversed from pivotal resistance level 150.00 - Likely to fall to…

3 days ago

Baidu Wave Analysis – 8 January 2026

Baidu: ⬇️ Sell - Baidu reversed from resistance zone - Likely to fall to support level…

3 days ago

This website uses cookies