Categories: Technical analysis

Ford Wave Analysis 11 August 2023

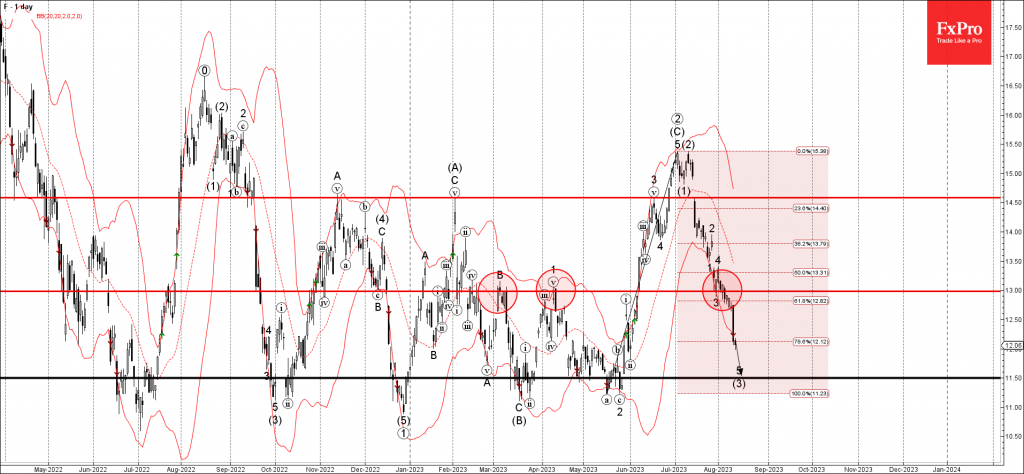
– Ford broke support level 13.00

– Likely to fall to support level 11.50

Ford recently broke the support level 13.00 (former monthly high from March and April, which also reversed the previous impulse wave 3 from the end of July).

The breakout of the support level 13.00 coincided with the breakout of the 61.8% Fibonacci correction of the previous upward impulse from May.

Ford can be expected to fall further toward the next support level 11.500 (target price for the completion of the active impulse waves 3 and (5)).

The FxPro Tech Analysis Team

The FxPro technical experts prepare a daily analysis of the most active currency pairs (majors, crosses, exotics) and commodities. Selected instruments are reviewed on daily trends (D1, H4), using the active Elliott Wave setups, Japanese candlesticks, indicators, and support/resistance levels.

Share
Published by
The FxPro Tech Analysis Team
Tags: Ford

Recent Posts

EURCAD Wave Analysis 6 September 2024

- EURCAD reversed from pivotal support level 1.4900 - Likely to rise to resistance level…

1 day ago

EURUSD Wave Analysis 6 September 2024

- EURUSD reversed from support level 1.1030 - Likely to rise to resistance level 1.1200…

1 day ago

Further Unwinding of Carry Trade

The unwinding of the carry trade in the FX market continues, with the major safe…

1 day ago

Bitcoin pressured by risk-off mood

Market Picture The pressure on risk assets continues, pushing the crypto market capitalisation back below…

2 days ago

AUDUSD Wave Analysis 5 September 2024

- AUDUSD reversed from support level 0.6700 - Likely to rise to resistance level 0.6800…

2 days ago

Gold Wave Analysis 5 September 2024

- Gold reversed from support level 2475.00 - Likely to rise to resistance level 2535.00…

2 days ago

This website uses cookies