Categories: Technical analysis

Ferrari Wave Analysis – 17 October, 2019

  • Ferrari broke daily down channel
  • Likely to rise to 163.20

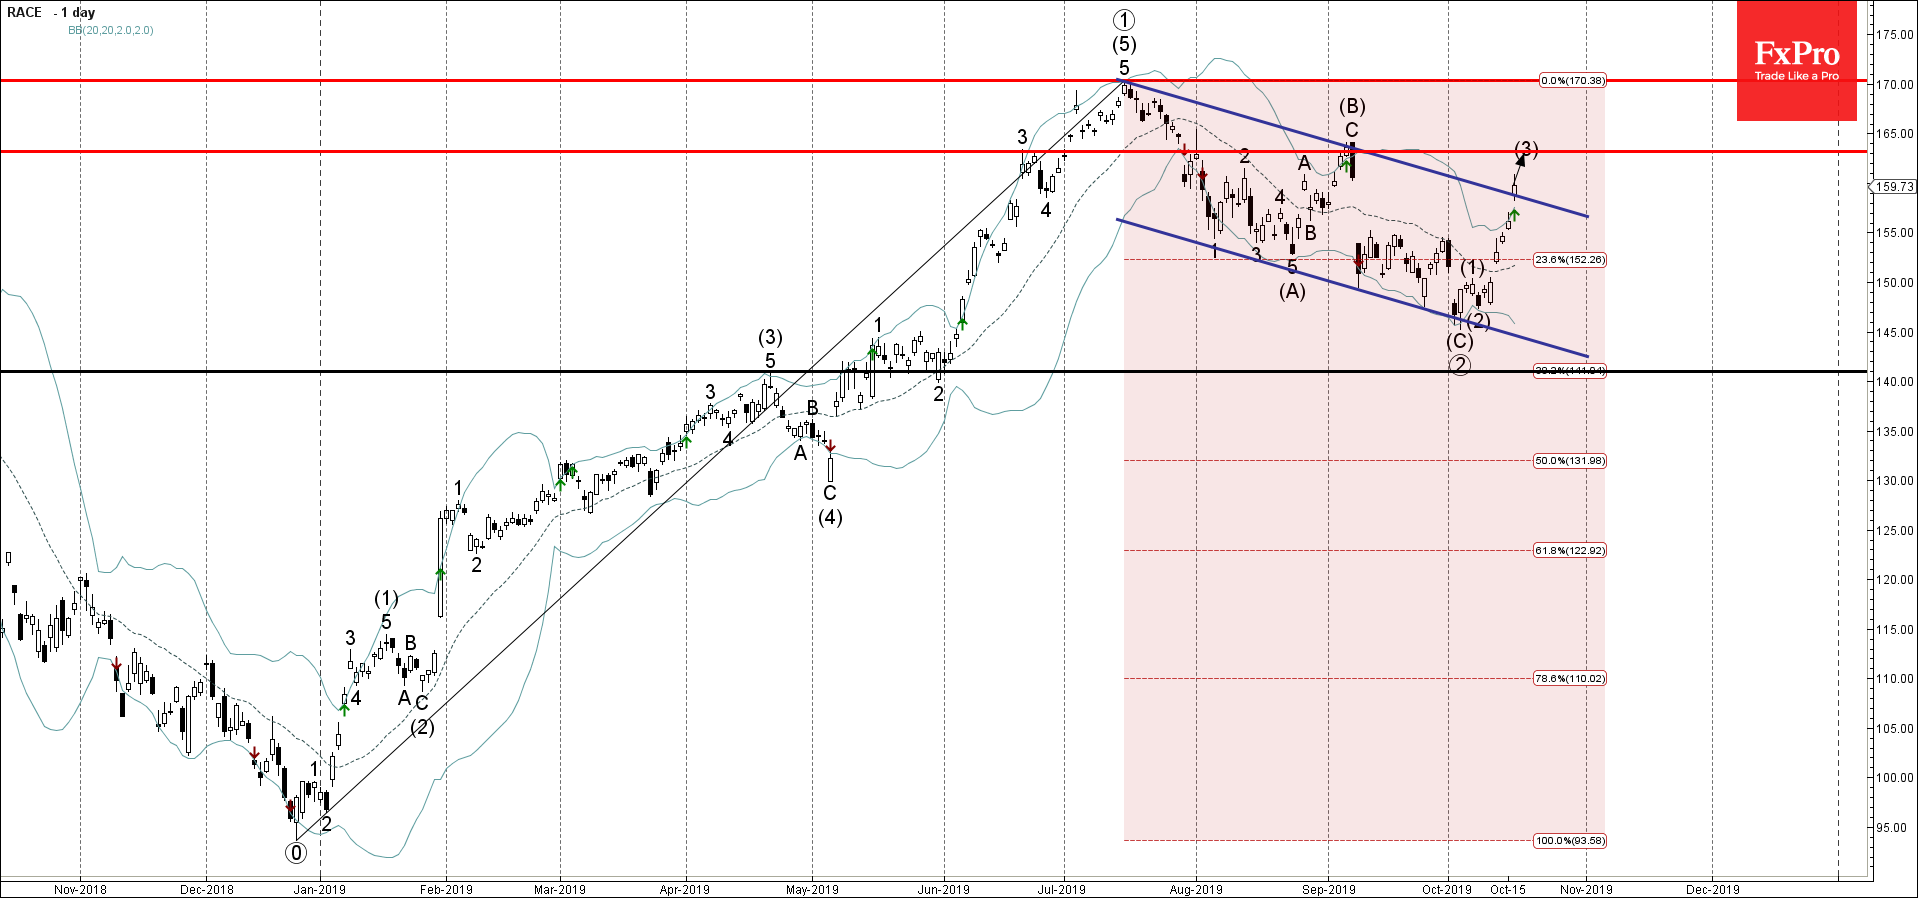
Ferrari recently broke the resistance trendline of the daily down channel from July – which encloses the previous long-term ABC correction ②.

The breakout of this down channel accelerated the active medium-term upward impulse sequence (3) from the start of October.

Ferrari is expected to rise further and retest the next resistance level 163.20 (top of the previous (B)-wave and the target price calculated for the completion of the active impulse wave (3)).

AddThis Website Tools
The FxPro Tech Analysis Team

The FxPro technical experts prepare a daily analysis of the most active currency pairs (majors, crosses, exotics) and commodities. Selected instruments are reviewed on daily trends (D1, H4), using the active Elliott Wave setups, Japanese candlesticks, indicators, and support/resistance levels.

Share
Published by
The FxPro Tech Analysis Team
Tags: RACE

Recent Posts

Tesla Wave Analysis – 21 March 2025

Tesla: ⬆️ Buy - Tesla reversed from support level 220.00 - Likely to rise to…

17 hours ago

Google Wave Analysis – 21 March 2025

Google: ⬆️ Buy - Google reversed from key support level 160.00 - Likely to rise…

17 hours ago

Silver Wave Analysis – 21 March 2025

Silver: ⬇️ Sell - Silver reversed from resistance level 34.00 - Likely to fall to…

19 hours ago

USDCHF Wave Analysis – 21 March 2025

USDCHF: ⬆️ Buy - USDCHF reversed from support level 0,8750 - Likely to fall to…

19 hours ago

What’s next: Flash PMIs, UK CPI & US PCE

The week ahead includes the release of the PMI business activity indexes for March, the…

1 day ago

Gold: Growth Opportunities

Gold has been in an uptrend, reaching record highs and offering growth opportunities. However, caution…

1 day ago