Categories: Technical analysis

Fedex Wave Analysis 30 November, 2020

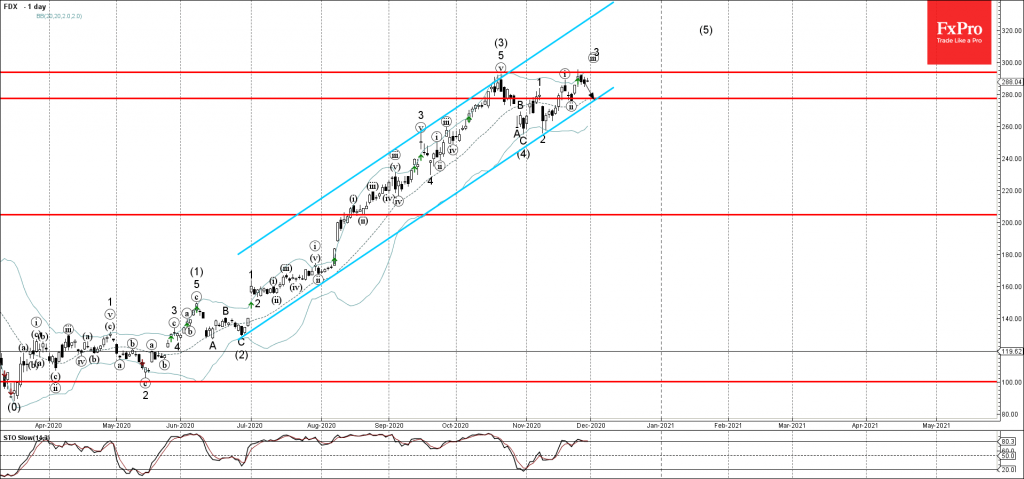
• Fedex reversed from resistance level 294.00

• Likely to fall to 280.00

Fedex recently reversed down from the key resistance level 294.00 (which stopped the sharp uptrend in the middle of October) standing close to the upper daily Bollinger Band.

The downward reversal from the resistance level 294.00 stopped the earlier short-term upward impulse waves (iii), 3 and (5).

Given the strength of the resistance level 294.00 and the – Fedex is expected to fall further toward the next support level 280.00 (support trendline of the daily up channel from June).

The FxPro Tech Analysis Team

The FxPro technical experts prepare a daily analysis of the most active currency pairs (majors, crosses, exotics) and commodities. Selected instruments are reviewed on daily trends (D1, H4), using the active Elliott Wave setups, Japanese candlesticks, indicators, and support/resistance levels.

Share
Published by
The FxPro Tech Analysis Team
Tags: FDX

Recent Posts

A slightly weaker CPI was not enough to break through the highs

US CPI data a bit softer than forecasts, sparking brief market optimism, but resistance remains.…

21 minutes ago

Crude Oil counteracts

Middle East tensions and Venezuelan supply shifts drive Brent crude volatility, with geopolitical risks and…

4 hours ago

Crypto market grows with risk appetite in stocks

Crypto market edges up as risk appetite returns; Bitcoin and Ethereum recover, despite investor caution…

5 hours ago

The yen returned to the Takaichi trade

The dollar resumed its growth after the lawsuit against the Fed chairman. Rumours of early…

6 hours ago

Nat Gas Current situation #tradelikeapro #trading #natgas #tradingstrategy #tradingshorts

Today is Tuesday, the 13th of January, and we will talk about the natural gas…

8 hours ago

Bitcoin Cash Wave Analysis – 12 January 2026

Bitcoin Cash: ⬇️ Sell - Bitcoin Cash reversed from resistance area - Likely to fall…

17 hours ago

This website uses cookies