Categories: Technical analysis

Fedex Wave Analysis – 14 February, 2020

  • Fedex broke multi-month resistance trendline
  • Likely to rise to 163.90

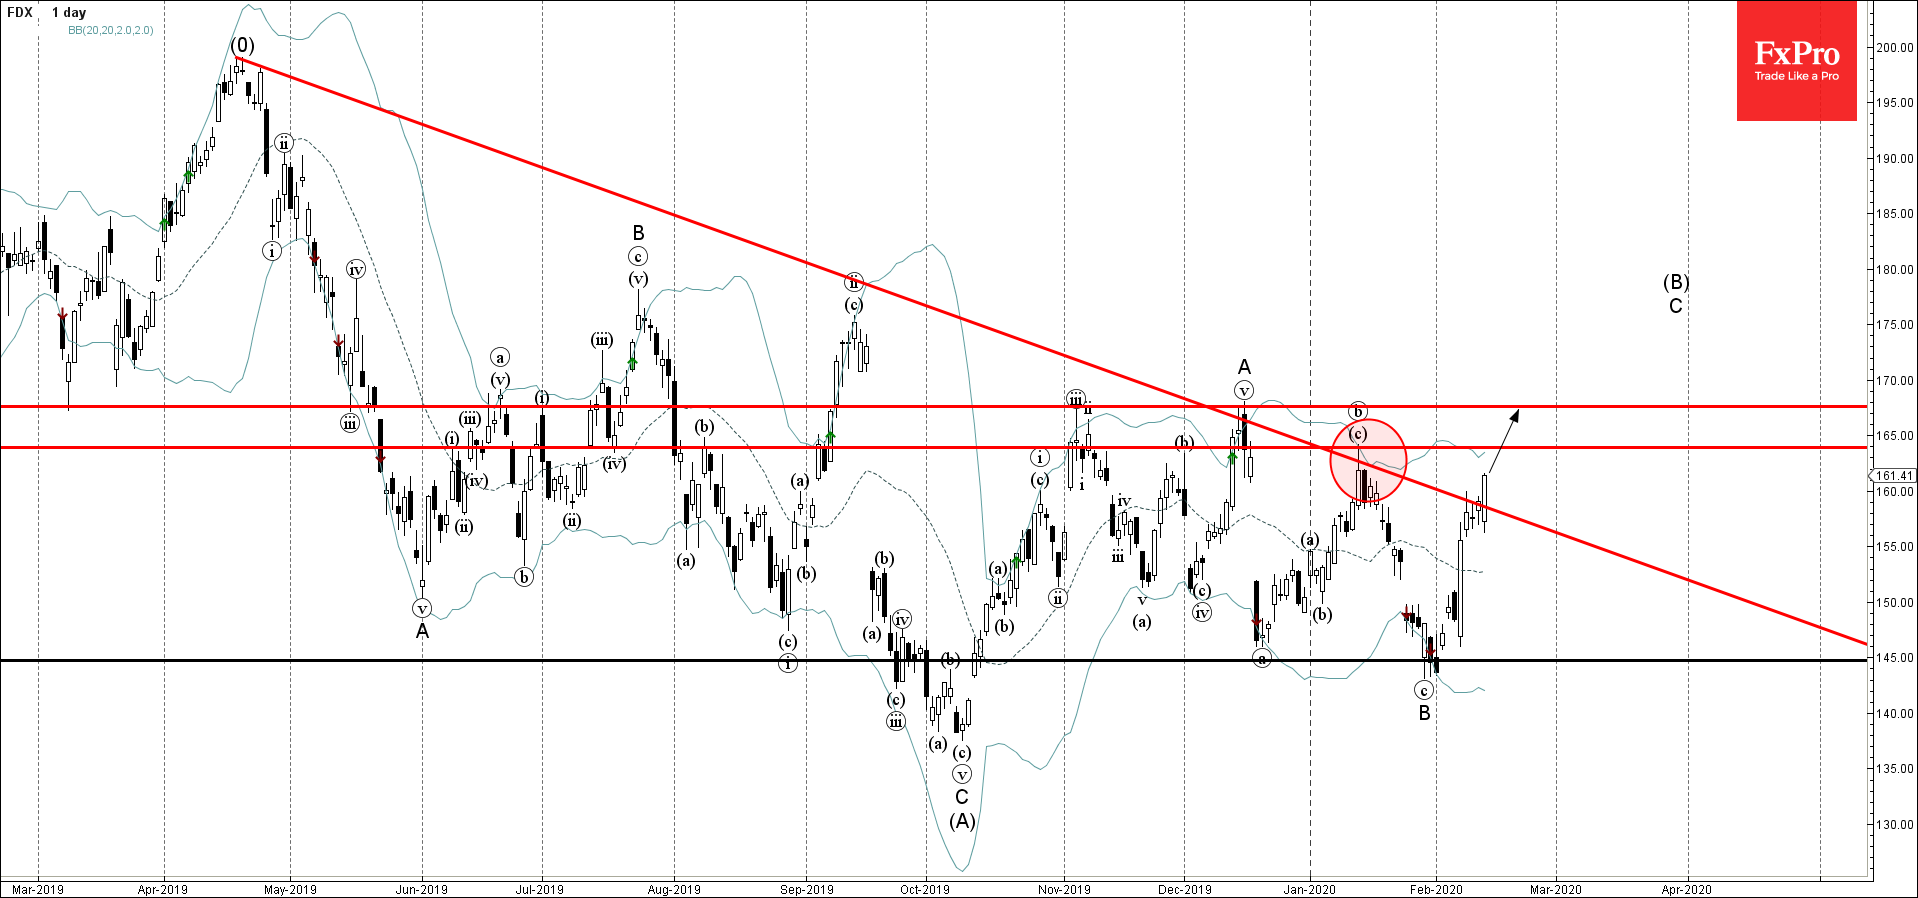
Fedex recently broke through the multi-month resistance trendline which has been reversing the price from April of 2019 – as can be seen below.

The breakout of this resistance trendline continues the active short-term impulse wave C of the ABC correction (B) from last October.

Fedex is likely to rise further in the active waves C and (B) toward the next resistance level 163.90 (top of the previous wave (b)) – the breakout of which can lead to further gains toward 167.60 (top of the earlier correction A).

The FxPro Tech Analysis Team

The FxPro technical experts prepare a daily analysis of the most active currency pairs (majors, crosses, exotics) and commodities. Selected instruments are reviewed on daily trends (D1, H4), using the active Elliott Wave setups, Japanese candlesticks, indicators, and support/resistance levels.

Share
Published by
The FxPro Tech Analysis Team
Tags: FDX

Recent Posts

Forex has set its priorities

In 2026, experts favour the yen, see modest euro growth, and expect pressure on the…

3 hours ago

Bear market rebound in crypto is likely to continue

Crypto rebounds continue; Bitcoin faces resistance, with a mixed market outlook ahead, as regulatory changes…

4 hours ago

Coca-Cola Wave Analysis – 4 December 2025

Coca-Cola: ⬇️ Sell - Coca-Cola reversed from long-term resistance level 73.25 - Likely to fall to…

18 hours ago

DraftKings Wave Analysis – 4 December 2025

DraftKings: ⬆️ Buy - DraftKings reversed from support zone - Likely to rise to resistance level…

18 hours ago

NVDA Wave Analysis – 4 December 2025

NVDA: ⬆️ Buy - NVDA reversed from support zone - Likely to rise to resistance level…

19 hours ago

Basic Attention Token Wave Analysis – 4 December 2025

Basic Attention Token: ⬇️ Sell - Basic Attention Token reversed from resistance level 0.2800 - Likely…

19 hours ago

This website uses cookies