Categories: Technical analysis

Fedex Wave Analysis – 04 March, 2020

  • Fedex broke key support level 140.00
  • Likely to fall to 128.00

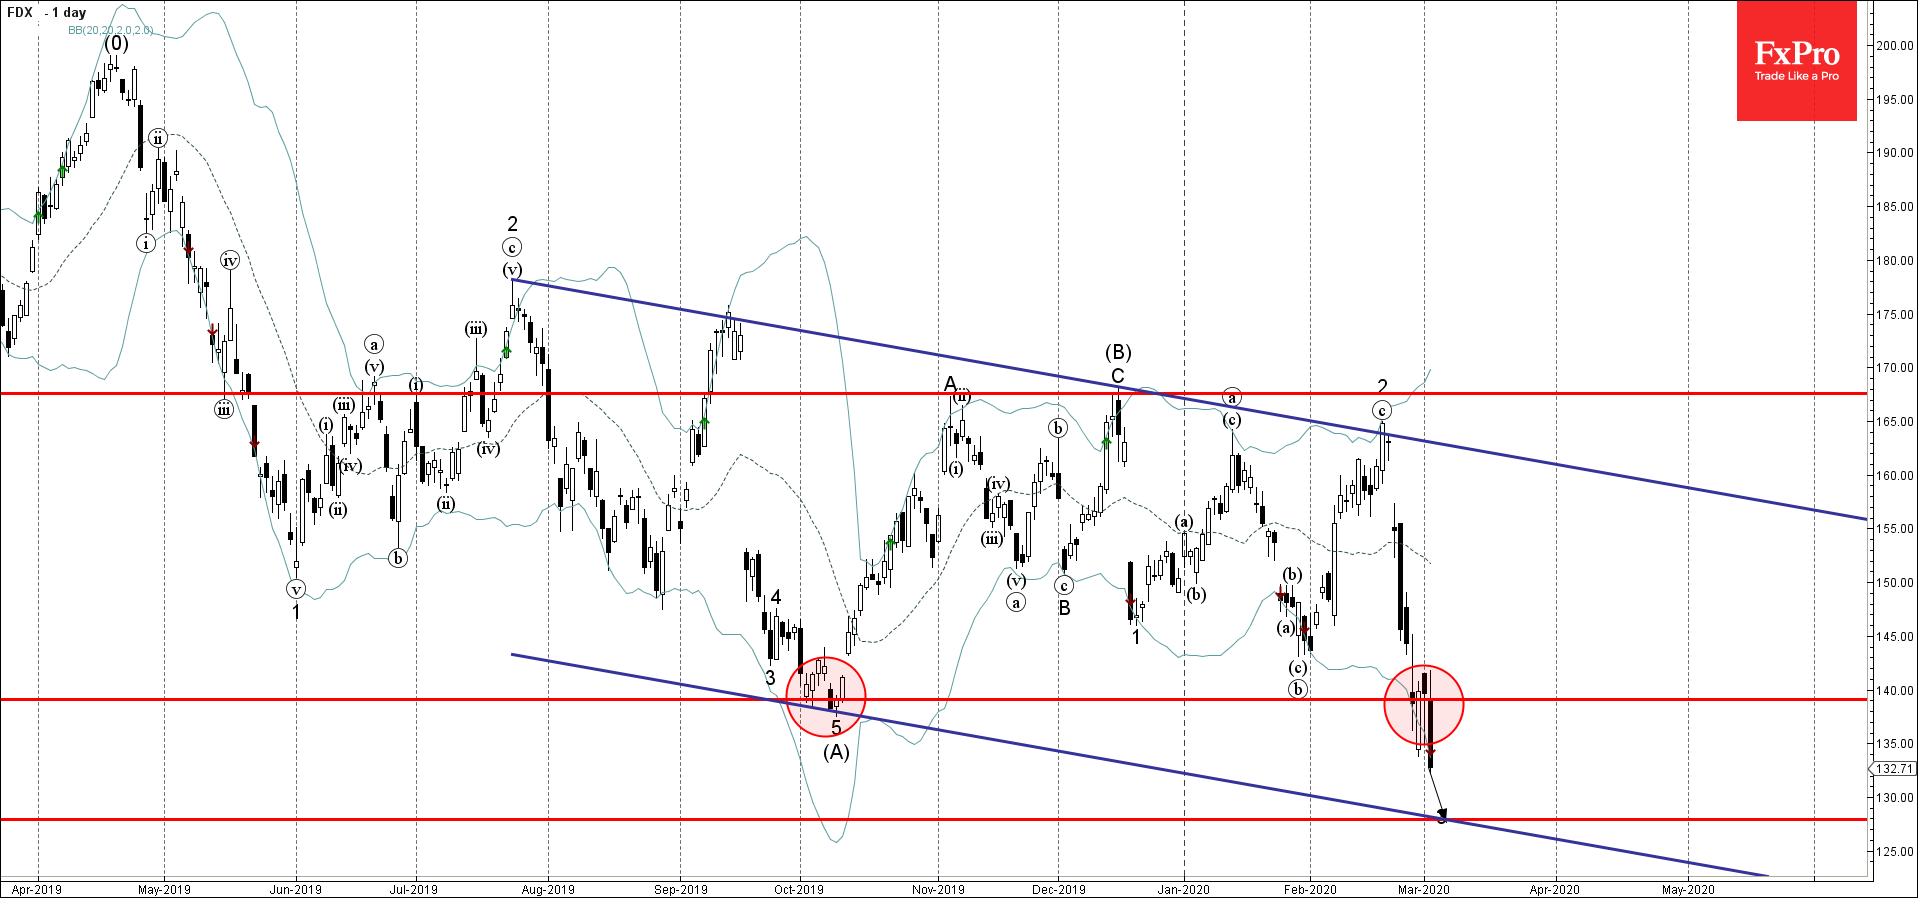
Fedex recently broke below the key support level 140.00 (which stopped the extended downtrend at the start of October, as can be seen below).

After breaking the aforementioned support level 140.00 made a failed attempt to break above this price level – giving a strong sell signal.

Given the strong overriding downtrend that can be seen on the daily Fedex charts  – the price is likely to fall further toward the next support level 128.00 (target price for the termination of the active impulse wave 3, interesting with the daily down channel form July).

The FxPro Tech Analysis Team

The FxPro technical experts prepare a daily analysis of the most active currency pairs (majors, crosses, exotics) and commodities. Selected instruments are reviewed on daily trends (D1, H4), using the active Elliott Wave setups, Japanese candlesticks, indicators, and support/resistance levels.

Share
Published by
The FxPro Tech Analysis Team
Tags: FDX

Recent Posts

Bitcoin Wave Analysis – 14 January 2026

Bitcoin: ⬆️ Buy - Bitcoin broke resistance area - Likely to rise to resistance level…

12 hours ago

NZDJPY Wave Analysis – 14 January 2026

NZDJPY: ⬇️ Sell - NZDJPY reversed down from the resistance area - Likely to fall…

12 hours ago

What is Leverage?

Leverage is a mechanism that lets traders control larger positions using smaller capital. By choosing…

16 hours ago

The dollar does not tolerate dissent

US GDP growth is driven not by the White House, but by AI. The Bank…

22 hours ago

The crypto market has made a breakthrough

The crypto market surges, hitting new highs, with bullish sentiment for Bitcoin and Ethereum amid…

22 hours ago

Brent Crude oil Wave Analysis – 13 January 2026

Brent Crude oil ⬆️ Buy - Brent Crude oil rising inside impulse wave c -…

2 days ago

This website uses cookies